AQA · GCSE · Biology
Course version: 8461 · Version from Sept 2018
A range of experimental methods using transects and quadrats are used by…
Full specification wording
Levels of organisation: A range of experimental methods using transects and quadrats are used by ecologists to determine the distribution and abundance of species in an ecosystem.
Ecologists sample ecosystems rather than counting every organism.
Checked against the AQA 8461 specification (opens in a new tab) on .
- Point 5 of 12
Study notes
From the checked teaching notes for this specification point.
The idea
Ecologists sample ecosystems rather than counting every organism. A quadrat is a square frame, often 0.25 m² or 1 m², placed at random coordinates to estimate abundance. Random placement avoids bias, and repeating the sample improves reliability. Abundance can be recorded as frequency, percentage cover or counts, depending on the organism. A transect is a line or belt across a habitat along which quadrats are placed at intervals to show how distribution changes with an environmental gradient such as light, moisture or trampling. Combining random quadrats with transects allows both abundance and distribution to be described, and results can be compared between areas or over time.
What earns the marks
- Describes random quadrat sampling to estimate abundance without counting every organism.
- Explains that quadrats are placed at random, for example using a random number generator and coordinates, to reduce bias.
- Describes a line or belt transect with quadrats at regular intervals to show distribution along a gradient.
- States that abundance may be measured as frequency, percentage cover or number of individuals.
- Explains that repeating samples and calculating a mean improves reliability of the estimate.
Common mistakes and how to put them right
Placing quadrats only where plants look interesting.
Put it right: Place them randomly so the sample represents the whole area.
Confusing a transect with a quadrat.
Put it right: A transect is a line or belt along which samples are taken, while a quadrat is the sampling frame.
Recording abundance only as a single count without repeats.
Put it right: Take several samples and calculate a mean to improve reliability.
Exam tips
- State the size of the quadrat and how many samples are taken when describing a method.
- Explain why random sampling is used, linking it to avoiding bias and representing the habitat.
- Use a transect when the question asks about distribution along a gradient, and quadrats when it asks about abundance.
Try the lesson
The start of the Levels of organisation: A range of experimental methods using transects and quadrats are used by ecologists to determine the distribution and abundance of species in an ecosystem. lesson, made from checked teaching notes for this specification point.
Have a go first
Which piece of apparatus is used by ecologists to sample the abundance of species in a small area?
Listen
Ecologists sample ecosystems rather than counting every organism. A quadrat is a square frame, often 0.25 m² or 1 m², placed at random coordinates to estimate abundance. Random placement avoids bias, and repeating the sample improves reliability. Abundance can be recorded as frequency, percentage cover or counts, depending on the organism. A transect is a line or belt across a habitat along which quadrats are placed at intervals to show how distribution changes with an environmental gradient such as light, moisture or trampling. Combining random quadrats with transects allows both abundance and distribution to be described, and results can be compared between areas or over time. A strong answer earns marks for these points. Describes random quadrat sampling to estimate abundance without counting every organism. Explains that quadrats are placed at random, for example using a random number generator and coordinates, to reduce bias. Describes a line or belt transect with quadrats at regular intervals to show distribution along a gradient. States that abundance may be measured as frequency, percentage cover or number of individuals. A common slip: Placing quadrats only where plants look interesting. Instead, place them randomly so the sample represents the whole area. Exam tip: State the size of the quadrat and how many samples are taken when describing a method.
See it
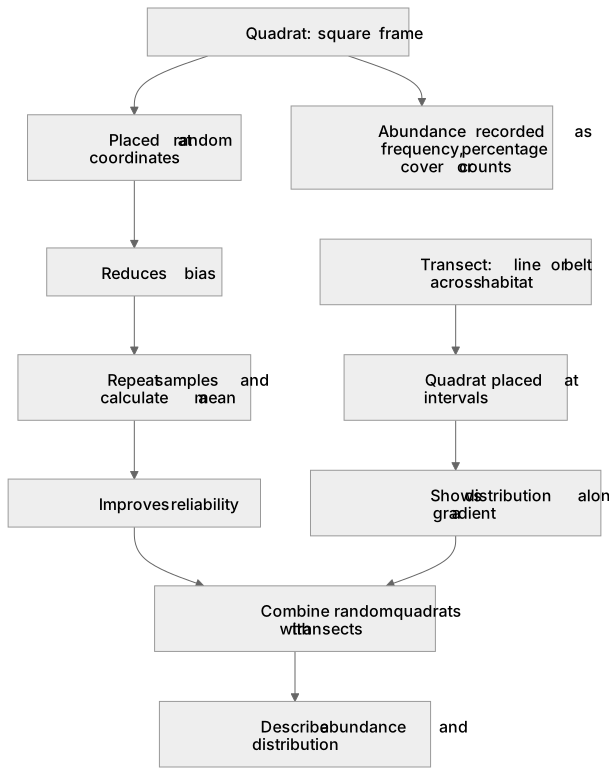
Label the diagram
Some boxes have lost their names. Pick the right name for each number.
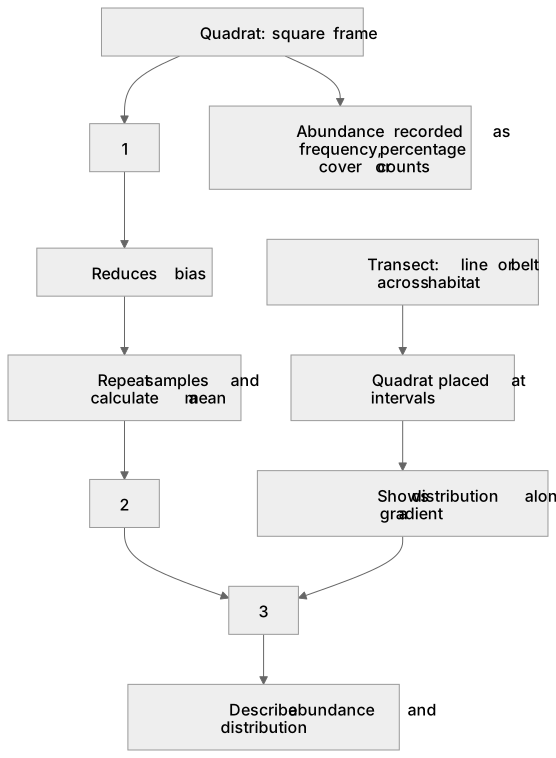
1Box 1
2Box 2
3Box 3
There is more to this lesson
The full lesson goes on to check your understanding and help you earn the marks. Create a free account to carry on, with your progress saved.
A week of Premium from your first lesson · Then the free plan continues · No card, no charge
Test your understanding of Levels of organisation: A range of experimental methods using transects and quadrats are used by ecologists to determine the distribution and abundance of species in an ecosystem.
Active recall beats re-reading. Take an instant quiz now to test what you’ve learned and lock it into long-term memory.
A week of Premium from your first lesson · Then the free plan continues · No card, no charge