AQA · GCSE · Biology
Course version: 8461 · Version from Sept 2018
In relation to abundance of organisms students should be able to: •…
Full specification wording
Levels of organisation: In relation to abundance of organisms students should be able to: • understand the terms mean, mode and median • calculate arithmetic means • plot and draw appropriate graphs selecting appropriate scales for the axes.
When studying abundance, you often collect repeated measurements, such as quadrat counts.
Checked against the AQA 8461 specification (opens in a new tab) on .
- Point 6 of 12
- 3 key terms
Study notes
From the checked teaching notes for this specification point.
The idea
When studying abundance, you often collect repeated measurements, such as quadrat counts. The mean is the arithmetic average: add all values and divide by the number of values. The mode is the most frequent value, useful for categorical data such as the most common species. The median is the middle value when data are ordered; for an even number of values, it is the mean of the two middle values. For example, counts 2, 3, 3, 5, 7 have mean 4, mode 3 and median 3. When plotting graphs, choose a sensible scale so the data fill the axes, label both axes with quantity and unit, and use a line graph for continuous data or a bar chart for categories. Select a scale that makes differences easy to see without distorting the pattern.
What earns the marks
- Define mean as the sum of all values divided by the number of values.
- Define mode as the value that occurs most often in a data set.
- Define median as the middle value when data are arranged in order, or the mean of the two middle values when there is an even number of values.
- Calculate an arithmetic mean correctly from a set of abundance data, including using a calculator where appropriate.
- Choose an appropriate graph type: line graph for continuous data, bar chart for discrete or categorical data.
- Select a scale for each axis that uses the available space and allows plotted points to be read accurately.
- Label axes with the variable and its unit, and give the graph a title where required.
Common mistakes and how to put them right
Calculating the mean by dividing by the wrong number of values.
Put it right: Count the number of values carefully and divide the total by that count.
Finding the median without ordering the data first.
Put it right: Arrange values in ascending order before identifying the middle.
Choosing a scale that does not fit the data, such as starting at zero when values are all between 80 and 90, or using uneven intervals.
Put it right: Use a consistent scale that covers the full range and uses most of the axis.
Plotting a line graph for categorical data such as species names.
Put it right: Use a bar chart for categories and a line graph for continuous variables.
Forgetting to label axes or include units.
Put it right: Write the quantity and unit, for example 'number of daisies per m²'.
Exam tips
- Show your working for the mean, especially if the numbers are not whole, so you can gain credit even if the final answer is wrong.
- When drawing a graph, check that the scale is uniform and that each axis is labelled with both the variable and its unit.
- If asked to plot data, use a sharp pencil and plot points accurately; for line graphs, join points with a ruler or draw a line of best fit as appropriate.
- Read the question carefully to decide whether a mean, mode or median is most appropriate for the data given.
Try the lesson
The start of the Levels of organisation: In relation to abundance of organisms students should be able to: • understand the terms mean, mode and median • calculate arithmetic means • plot and draw appropriate graphs selecting appropriate scales for the axes. lesson, made from checked teaching notes for this specification point.
Have a go first
A student records the number of daisies in five quadrats: 3, 5, 5, 7, 10. What is the mode of these values?
Listen
When studying abundance, you often collect repeated measurements, such as quadrat counts. The mean is the arithmetic average: add all values and divide by the number of values. The mode is the most frequent value, useful for categorical data such as the most common species. The median is the middle value when data are ordered; for an even number of values, it is the mean of the two middle values. For example, counts 2, 3, 3, 5, 7 have mean 4, mode 3 and median 3. When plotting graphs, choose a sensible scale so the data fill the axes, label both axes with quantity and unit, and use a line graph for continuous data or a bar chart for categories. Select a scale that makes differences easy to see without distorting the pattern. A strong answer earns marks for these points. Define mean as the sum of all values divided by the number of values. Define mode as the value that occurs most often in a data set. Define median as the middle value when data are arranged in order, or the mean of the two middle values when there is an even number of values. Calculate an arithmetic mean correctly from a set of abundance data, including using a calculator where appropriate. A common slip: Calculating the mean by dividing by the wrong number of values. Instead, count the number of values carefully and divide the total by that count. Exam tip: Show your working for the mean, especially if the numbers are not whole, so you can gain credit even if the final answer is wrong.
See it
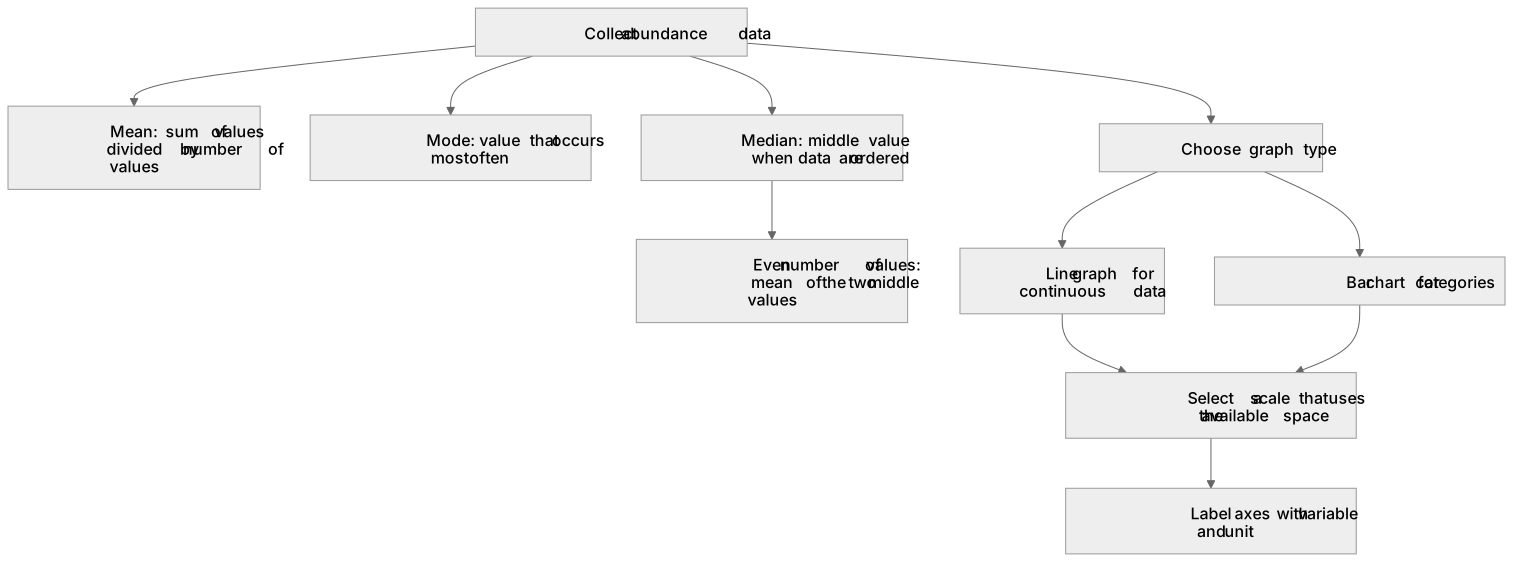
Key words
Say what each word means before you turn the card.
Mean
Try answering aloud or in your head before turning the card.
Mode
Try answering aloud or in your head before turning the card.
Median
Try answering aloud or in your head before turning the card.
See every definition
- Mean
- The arithmetic average: add all values and divide by the number of values.
- Mode
- The most frequent value, useful for categorical data such as the most common species.
- Median
- The middle value when data are ordered; for an even number of values, it is the mean of the two middle values.
Label the diagram
Some boxes have lost their names. Pick the right name for each number.
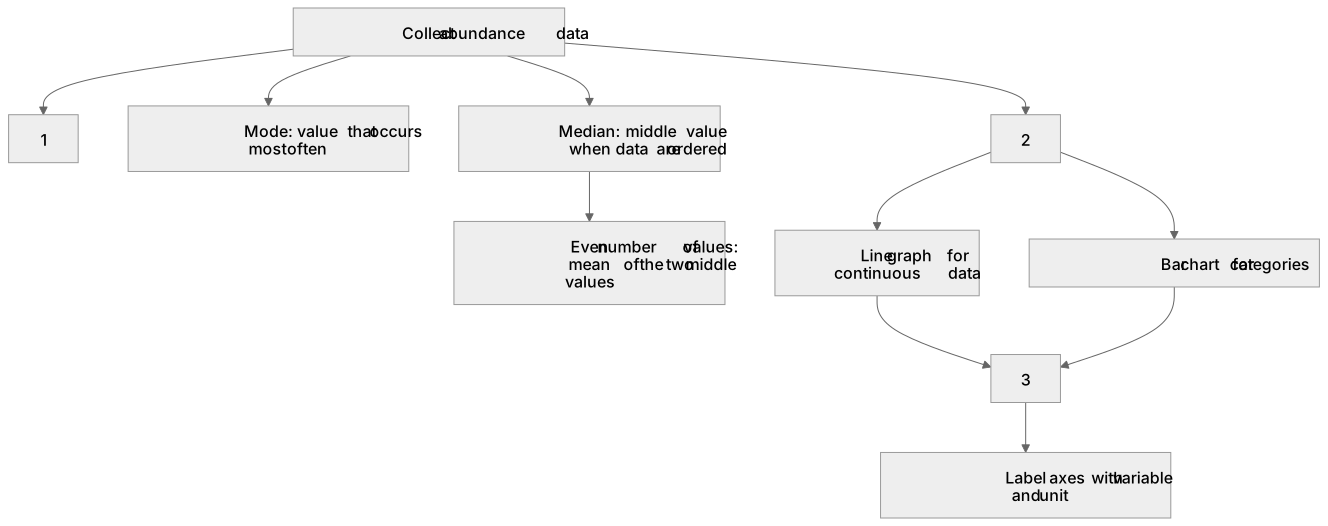
1Box 1
2Box 2
3Box 3
There is more to this lesson
The full lesson goes on to check your understanding and help you earn the marks. Create a free account to carry on, with your progress saved.
A week of Premium from your first lesson · Then the free plan continues · No card, no charge
Test your understanding of Levels of organisation: In relation to abundance of organisms students should be able to: • understand the terms mean, mode and median • calculate arithmetic means • plot and draw appropriate graphs selecting appropriate scales for the axes.
Active recall beats re-reading. Take an instant quiz now to test what you’ve learned and lock it into long-term memory.
A week of Premium from your first lesson · Then the free plan continues · No card, no charge