AQA · GCSE · Biology
Course version: 8461 · Version from Sept 2018
Students should be able to: • translate information between graphical and…
Full specification wording
Plant organ system: Students should be able to: • translate information between graphical and numerical form • plot and draw appropriate graphs, selecting appropriate scales for axes • extract and interpret information from graphs, charts and tables.
This skill underpins practical work on plant transport.
Checked against the AQA 8461 specification (opens in a new tab) on .
- Point 4 of 13
- 3 key terms
Study notes
From the checked teaching notes for this specification point.
The idea
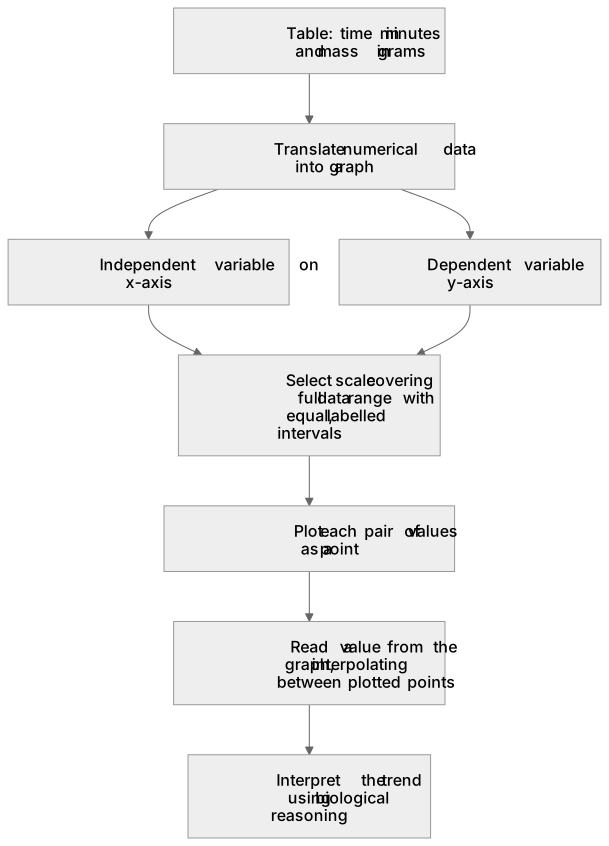
This skill underpins practical work on plant transport. Suppose a student measures the mass of a leafy shoot on a balance every 5 minutes as it transpires. They record a table of time in minutes and mass in grams, then translate that numerical data into a line graph: time on the x-axis, mass on the y-axis. Choosing a scale means making each axis span the data range with equal, labelled intervals, so the plotted points are spread out and easy to read. Extracting information means reading a value from the graph, such as the mass at 12 minutes, by interpolating between plotted points. Interpreting means explaining the trend, for example that mass falls fastest in warm, moving air because transpiration removes water vapour quickly.
What earns the marks
- Translate numerical data into a graph by placing the independent variable on the x-axis and the dependent variable on the y-axis, then plotting each pair of values as a point.
- Translate graphical information back into numerical form by reading values from axes, including interpolating between labelled points when the required value is not plotted directly.
- Select a scale for each axis that covers the full data range, uses equal intervals and makes efficient use of the available grid so points are clearly separated.
- Draw appropriate graphs for the data type, using a line graph with a line of best fit for continuous data and a bar chart for discrete categories.
- Extract information from charts and tables by identifying the relevant row, column or plotted point and quoting the value with its correct unit.
- Interpret trends and relationships, such as describing the rate of change from a graph gradient or explaining a pattern in terms of the underlying biology.
Common mistakes and how to put them right
Plotting the independent variable on the y-axis instead of the x-axis.
Put it right by deciding which variable the student changed and placing it on the x-axis.
Choosing a scale with unequal intervals or one that leaves most of the grid unused.
Put it right by counting the squares available and setting a regular interval that fills the axis.
Reading a graph value by counting grid lines rather than using the labelled scale.
Put it right by checking the value of each major division before estimating between them.
Exam tips
- Label both axes with the quantity and its unit, and give the graph a title that identifies what is being shown.
- When asked to read a value, show your working by marking the point on the graph and stating the value with its unit.
- For an interpretation question, quote specific data from the graph or table and link it to a biological process rather than describing the shape alone.
Try the lesson
The start of the Plant organ system: Students should be able to: • translate information between graphical and numerical form • plot and draw appropriate graphs, selecting appropriate scales for axes • extract and interpret information from graphs, charts and tables. lesson, made from checked teaching notes for this specification point.
Have a go first
A student records the total mass of water lost from a leafy shoot over a five-hour period. The results are shown in the table below.
| Time in hours | Total mass of water lost in g |
|---|---|
| 0 | 0 |
| 1 | 4 |
| 2 | 8 |
| 3 | 12 |
| 4 | 16 |
| 5 | 20 |
What is the mean rate of water loss per hour?
Listen
This skill underpins practical work on plant transport. Suppose a student measures the mass of a leafy shoot on a balance every 5 minutes as it transpires. They record a table of time in minutes and mass in grams, then translate that numerical data into a line graph: time on the x-axis, mass on the y-axis. Choosing a scale means making each axis span the data range with equal, labelled intervals, so the plotted points are spread out and easy to read. Extracting information means reading a value from the graph, such as the mass at 12 minutes, by interpolating between plotted points. Interpreting means explaining the trend, for example that mass falls fastest in warm, moving air because transpiration removes water vapour quickly. A strong answer earns marks for these points. Translate numerical data into a graph by placing the independent variable on the x-axis and the dependent variable on the y-axis, then plotting each pair of values as a point. Translate graphical information back into numerical form by reading values from axes, including interpolating between labelled points when the required value is not plotted directly. Select a scale for each axis that covers the full data range, uses equal intervals and makes efficient use of the available grid so points are clearly separated. Draw appropriate graphs for the data type, using a line graph with a line of best fit for continuous data and a bar chart for discrete categories. A common slip: Plotting the independent variable on the y-axis instead of the x-axis. Instead, deciding which variable the student changed and placing it on the x-axis. Exam tip: Label both axes with the quantity and its unit, and give the graph a title that identifies what is being shown.
See it
Key words
Say what each word means before you turn the card.
Translate information between graphical and numerical form
Try answering aloud or in your head before turning the card.
Plot and draw appropriate graphs
Try answering aloud or in your head before turning the card.
Selecting appropriate scales for axes
Try answering aloud or in your head before turning the card.
See every definition
- Translate information between graphical and numerical form
- Moving data between a graph and numbers, such as plotting each pair of values as a point or reading values from axes, including interpolating between labelled points.
- Plot and draw appropriate graphs
- Using a line graph with a line of best fit for continuous data and a bar chart for discrete categories, with the independent variable on the x-axis and the dependent variable on the y-axis.
- Selecting appropriate scales for axes
- Choosing a scale for each axis that covers the full data range, uses equal intervals and makes efficient use of the available grid so points are clearly separated.
Label the diagram
Some boxes have lost their names. Pick the right name for each number.
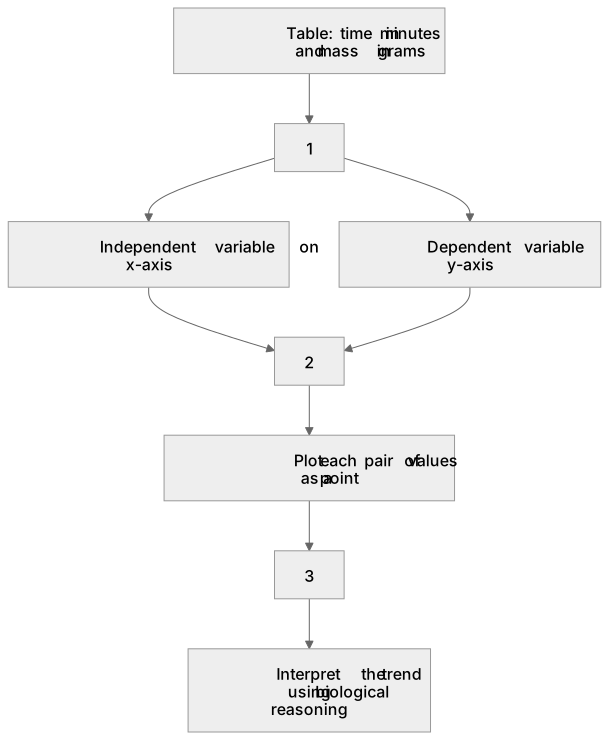
1Box 1
2Box 2
3Box 3
There is more to this lesson
The full lesson goes on to check your understanding and help you earn the marks. Create a free account to carry on, with your progress saved.
A week of Premium from your first lesson · Then the free plan continues · No card, no charge
Test your understanding of Plant organ system: Students should be able to: • translate information between graphical and numerical form • plot and draw appropriate graphs, selecting appropriate scales for axes • extract and interpret information from graphs, charts and tables.
Active recall beats re-reading. Take an instant quiz now to test what you’ve learned and lock it into long-term memory.
A week of Premium from your first lesson · Then the free plan continues · No card, no charge