AQA · GCSE · Biology
Course version: 8461 · Version from Sept 2018
Students should be able to extract and interpret data from graphs, charts…
Full specification wording
Structure and function: Students should be able to extract and interpret data from graphs, charts and tables, about the functioning of the nervous system.
Nervous system data often appear as tables of reaction times, bar charts comparing groups, or line graphs showing how a response changes with a variable such as caffeine intake or age.
Checked against the AQA 8461 specification (opens in a new tab) on .
- Point 10 of 13
Study notes
From the checked teaching notes for this specification point.
The idea
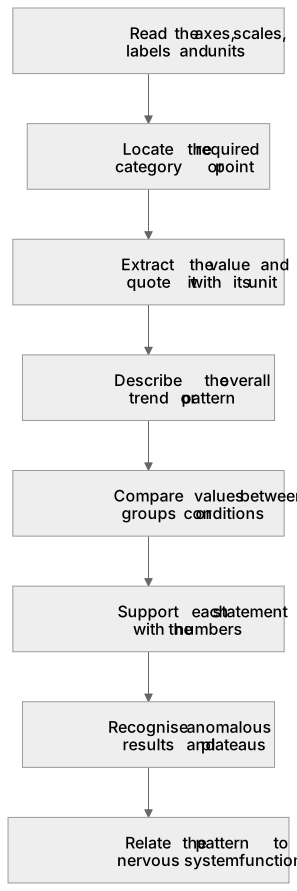
Nervous system data often appear as tables of reaction times, bar charts comparing groups, or line graphs showing how a response changes with a variable such as caffeine intake or age. To extract data, read the axes and units carefully, locate the required category or point, and quote the value with its unit. To interpret data, describe the overall trend, compare values between groups or conditions, and use the numbers to support each statement. For example, a bar chart might show that mean reaction time falls from 0.30 s to 0.22 s after a period of practice, indicating improved speed. You should also recognise anomalous results, describe patterns such as a plateau, and relate the pattern to nervous system function, for example faster impulse transmission or increased alertness.
What earns the marks
- Read the axes, scales, labels and units before quoting any value from a graph or chart.
- Extract a specific value or pair of values accurately from a table, graph or chart.
- Describe the overall trend or pattern shown by the data, such as an increase, decrease or plateau.
- Compare data between conditions or groups using numerical evidence.
- Relate the pattern to nervous system function, for example changes in reaction time or impulse transmission.
Common mistakes and how to put them right
Quoting a value without its unit.
Put it right by including the unit shown on the axis or in the table heading.
Describing a trend without using data.
Put it right by quoting at least one relevant value to support the description.
Reading a scale incorrectly, for example treating each minor division as one unit when it represents a different interval.
Put it right by checking the numbered intervals before reading points.
Exam tips
- Underline the command word and the variable you are asked about before reading the data.
- Use the phrase ‘as X increases, Y decreases’ and then quote values to support it.
- Check whether the question asks you to extract a value, describe a trend or compare groups, and answer only that.
Try the lesson
The start of the Structure and function: Students should be able to extract and interpret data from graphs, charts and tables, about the functioning of the nervous system. lesson, made from checked teaching notes for this specification point.
Have a go first
A student investigated the effect of caffeine on reaction time. They recorded the reaction times of four participants before and after consuming a caffeinated drink.
| Participant | Reaction time before (ms) | Reaction time after (ms) |
|---|---|---|
| A | 270 | 200 |
| B | 290 | 240 |
| C | 260 | 220 |
| D | 280 | 220 |
Which participant showed the greatest improvement in their reaction time after consuming the drink?
Listen
Nervous system data often appear as tables of reaction times, bar charts comparing groups, or line graphs showing how a response changes with a variable such as caffeine intake or age. To extract data, read the axes and units carefully, locate the required category or point, and quote the value with its unit. To interpret data, describe the overall trend, compare values between groups or conditions, and use the numbers to support each statement. For example, a bar chart might show that mean reaction time falls from 0.30 s to 0.22 s after a period of practice, indicating improved speed. You should also recognise anomalous results, describe patterns such as a plateau, and relate the pattern to nervous system function, for example faster impulse transmission or increased alertness. A strong answer earns marks for these points. Read the axes, scales, labels and units before quoting any value from a graph or chart. Extract a specific value or pair of values accurately from a table, graph or chart. Describe the overall trend or pattern shown by the data, such as an increase, decrease or plateau. Compare data between conditions or groups using numerical evidence. A common slip: Quoting a value without its unit. Instead, including the unit shown on the axis or in the table heading. Exam tip: Underline the command word and the variable you are asked about before reading the data.
See it
Put it in order
Put these steps in the order they happen.
- 1. Compare values between groups or conditions
- 2. Relate the pattern to nervous system function
- 3. Support each statement with the numbers
- 4. Read the axes, scales, labels and units
- 5. Locate the required category or point
- 6. Recognise anomalous results and plateaus
- 7. Extract the value and quote it with its unit
- 8. Describe the overall trend or pattern
Watch it explained
What is the one idea the video explains? Say it in a sentence.
Read the described scene instead
Nervous system data often appear as tables of reaction times, bar charts comparing groups, or line graphs showing how a response changes with a variable such as caffeine intake or age. Before quoting any value, read the axes, scales, labels and units carefully. Then locate the required category or point and quote the value with its unit. A question about nervous system data may ask you to extract a value, describe a trend, compare groups, or recognise an anomalous result. Use the numbers as evidence. For each, link the pattern to nervous system function, such as reaction time or impulse transmission. Before quoting any value, read the axes, scales, labels and units. Check numbered intervals, because each minor division may not represent one unit. Then locate the required category or point and extract the value or pair of values accurately. A bar chart might show mean reaction time for two conditions. Pause to think how you would extract and compare the values. The chart shows 0.30 seconds before practice and 0.22 seconds after practice. The mean reaction time is lower after practice, indicating improved speed. Three common mistakes are quoting a value without its unit, describing a trend without using data, and reading a scale incorrectly. To correct these, always include the unit shown, quote at least one relevant value to support a trend, and check numbered intervals before reading points. For nervous system data, first read axes, scales, labels and units. Extract specific values accurately, then describe the overall trend or pattern, such as an increase, decrease or plateau. Compare conditions using numerical evidence and relate the pattern to nervous system function, for example changes in reaction time or impulse transmission.
Label the diagram
Some boxes have lost their names. Pick the right name for each number.
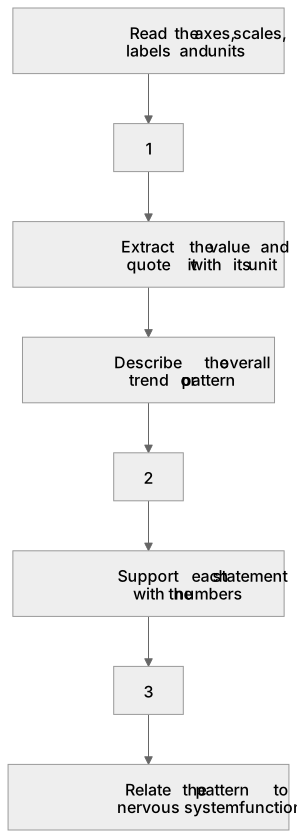
1Box 1
2Box 2
3Box 3
There is more to this lesson
The full lesson goes on to check your understanding and help you earn the marks. Create a free account to carry on, with your progress saved.
A week of Premium from your first lesson · Then the free plan continues · No card, no charge
Test your understanding of Structure and function: Students should be able to extract and interpret data from graphs, charts and tables, about the functioning of the nervous system.
Active recall beats re-reading. Take an instant quiz now to test what you’ve learned and lock it into long-term memory.
A week of Premium from your first lesson · Then the free plan continues · No card, no charge