AQA · GCSE · Biology
Course version: 8461 · Version from Sept 2018
Students should be able to translate information about reaction times…
Full specification wording
Structure and function: Students should be able to translate information about reaction times between numerical and graphical forms.
Reaction time data can be presented as a table of numerical values or as a graph, and you may need to move between the two.
Checked against the AQA 8461 specification (opens in a new tab) on .
- Point 11 of 13
Study notes
From the checked teaching notes for this specification point.
The idea
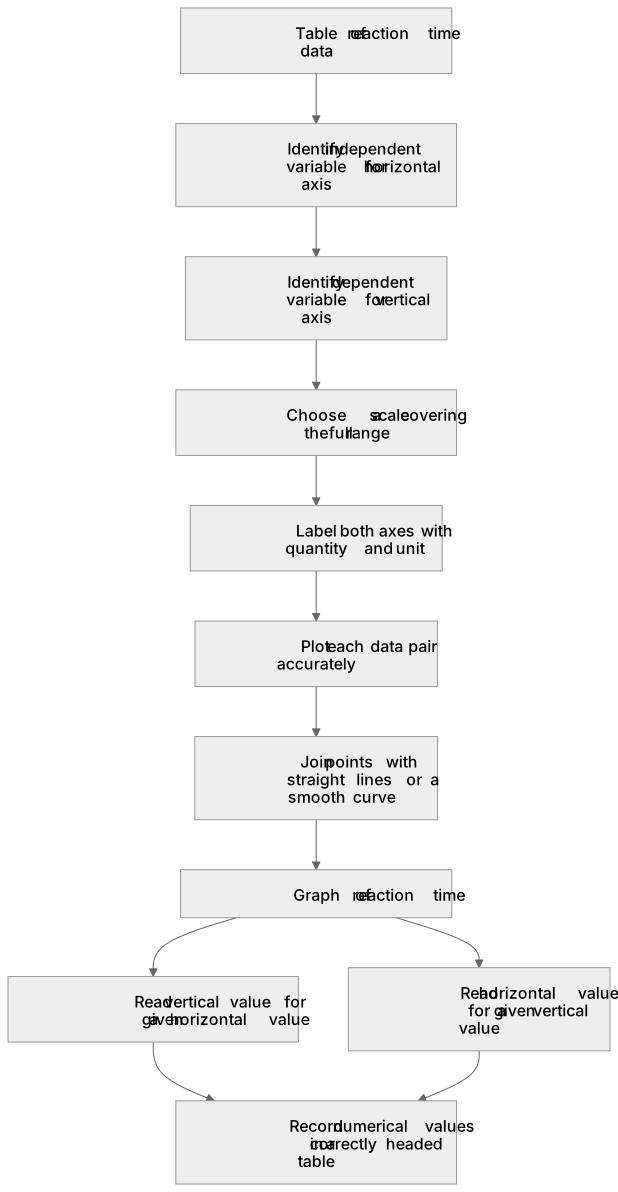
Reaction time data can be presented as a table of numerical values or as a graph, and you may need to move between the two. To translate from a table to a graph, choose a sensible scale, label both axes with the variable and unit, plot each pair of values accurately, and join points with straight lines or a smooth curve as appropriate. To translate from a graph to numerical form, read the value on the vertical axis for a given value on the horizontal axis, or read the horizontal value for a given vertical value. For example, if a graph shows reaction time falling as practice time increases, you can read that at 4 minutes the reaction time is 0.24 s and record this in a table. Always keep units consistent and check that plotted points match the original data.
What earns the marks
- Identify the independent variable for the horizontal axis and the dependent variable for the vertical axis.
- Choose a scale that uses the available space and makes plotting accurate.
- Plot each data pair correctly and label both axes with quantity and unit.
- Read values from a graph accurately, including interpolating between plotted points where needed.
- Record numerical values in a correctly headed table with consistent units.
Common mistakes and how to put them right
Plotting the dependent variable on the horizontal axis.
Put it right by placing the independent variable on the horizontal axis and the dependent variable on the vertical axis.
Using an uneven or unsuitable scale.
Put it right by choosing equal intervals that cover the full range of data.
Omitting units from axis labels or table headings.
Put it right by including the unit with every quantity.
Exam tips
- Check the range of values before choosing a scale so that all points fit on the grid.
- Use a sharp pencil and plot points as small crosses for accuracy.
- When reading a graph, state the value and unit and show how you used the axes.
Try the lesson
The start of the Structure and function: Students should be able to translate information about reaction times between numerical and graphical forms. lesson, made from checked teaching notes for this specification point.
Have a go first
A student measures their reaction time using the ruler drop test and records a value of 0.30 s. They want to plot this numerical result on a bar chart where the y-axis has a scale of 1 cm = 0.05 s. How tall should the bar be drawn to correctly represent this reaction time?
Listen
Reaction time data can be presented as a table of numerical values or as a graph, and you may need to move between the two. To translate from a table to a graph, choose a sensible scale, label both axes with the variable and unit, plot each pair of values accurately, and join points with straight lines or a smooth curve as appropriate. To translate from a graph to numerical form, read the value on the vertical axis for a given value on the horizontal axis, or read the horizontal value for a given vertical value. For example, if a graph shows reaction time falling as practice time increases, you can read that at 4 minutes the reaction time is 0.24 s and record this in a table. Always keep units consistent and check that plotted points match the original data. A strong answer earns marks for these points. Identify the independent variable for the horizontal axis and the dependent variable for the vertical axis. Choose a scale that uses the available space and makes plotting accurate. Plot each data pair correctly and label both axes with quantity and unit. Read values from a graph accurately, including interpolating between plotted points where needed. A common slip: Plotting the dependent variable on the horizontal axis. Instead, placing the independent variable on the horizontal axis and the dependent variable on the vertical axis. Exam tip: Check the range of values before choosing a scale so that all points fit on the grid.
See it
Label the diagram
Some boxes have lost their names. Pick the right name for each number.
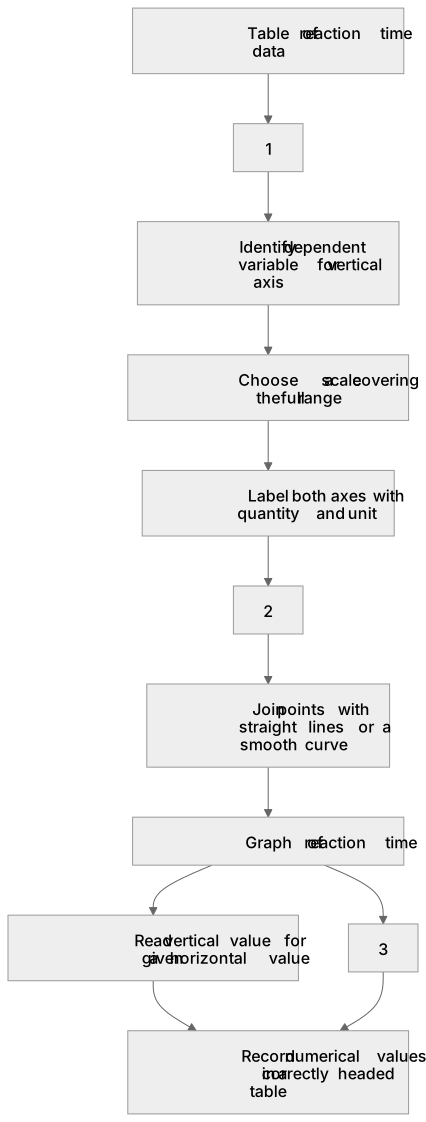
1Box 1
2Box 2
3Box 3
There is more to this lesson
The full lesson goes on to check your understanding and help you earn the marks. Create a free account to carry on, with your progress saved.
A week of Premium from your first lesson · Then the free plan continues · No card, no charge
Test your understanding of Structure and function: Students should be able to translate information about reaction times between numerical and graphical forms.
Active recall beats re-reading. Take an instant quiz now to test what you’ve learned and lock it into long-term memory.
A week of Premium from your first lesson · Then the free plan continues · No card, no charge