AQA · GCSE · Biology
Course version: 8461 · Version from Sept 2018
Students should be able to translate information between graphical and…
Full specification wording
The effect of lifestyle on some non-communicable diseases: Students should be able to translate information between graphical and numerical forms; and extract and interpret information from charts, graphs and tables in terms of risk factors.
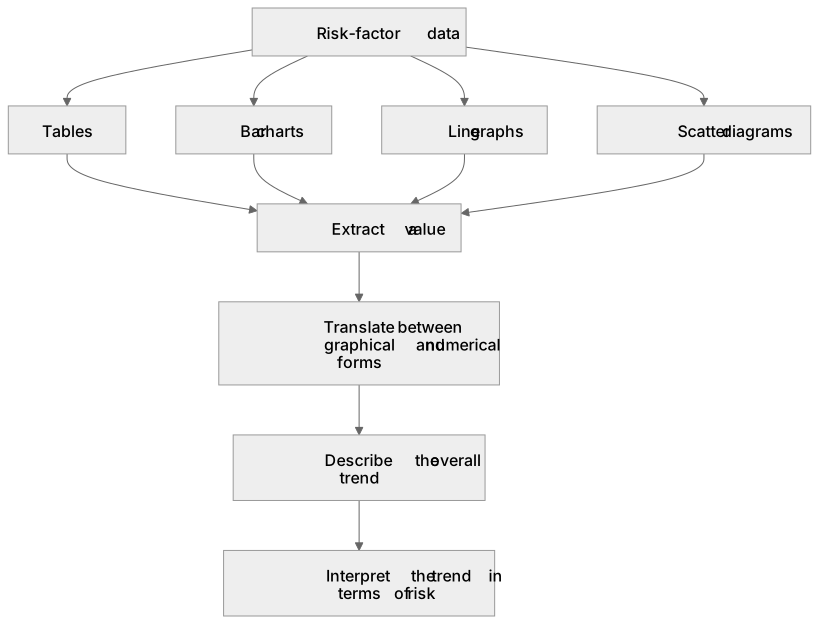
Risk-factor data are often presented as tables, bar charts, line graphs or scatter diagrams.
Checked against the AQA 8461 specification (opens in a new tab) on .
- Point 8 of 9
- 4 key terms
Study notes
From the checked teaching notes for this specification point.
The idea
Risk-factor data are often presented as tables, bar charts, line graphs or scatter diagrams. Translating between forms means reading a value from a graph and writing it as a number, or plotting numerical data as a graph. Extracting information means locating the required value, such as the death rate for a given exposure. Interpreting means explaining what the pattern shows about risk, for example that as the number of cigarettes smoked per day increases, the risk of lung cancer increases. You should read axes carefully, including units and scales, and describe trends using comparative terms such as higher, lower, increases or decreases.
What earns the marks
- Reads values accurately from axes, tables or chart labels, including correct units.
- Translates a value from a graph into numerical form, or plots given numerical data correctly.
- Describes the overall trend shown, such as an increase, decrease or no clear change.
- Interprets the trend in terms of risk factors, linking exposure to the likelihood of a non-communicable disease.
- Compares data for different groups, for example smokers and non-smokers, using values from the graph or table.
- Uses appropriate comparative vocabulary such as higher, lower, greater risk or reduced risk.
Common mistakes and how to put them right
Misreading the scale on an axis, for example treating each grid line as one unit when it represents ten.
Put it right by checking the labelled intervals before reading values.
Describing only one data point instead of the overall trend.
Put it right by summarising the pattern across the range of data.
Confusing correlation with cause.
Put it right by stating that the data show an association, while other factors may also contribute.
Exam tips
- Quote figures from the graph or table to support your description, including units where given.
- Use the command word: describe means state the pattern, while explain means give a reason linked to risk.
- Check whether the graph shows risk increasing or decreasing before writing your answer.
Try the lesson
The start of the The effect of lifestyle on some non-communicable diseases: Students should be able to translate information between graphical and numerical forms; and extract and interpret information from charts, graphs and tables in terms of risk factors. lesson, made from checked teaching notes for this specification point.
Have a go first
A health study presents data on daily sugar intake and the incidence of type 2 diabetes in a table:
| Daily sugar intake (g/day) | Incidence of type 2 diabetes (%) |
|---|---|
| 10 | 3 |
| 30 | 7 |
| 50 | 12 |
| 70 | 18 |
Based on extracting and interpreting this data, what conclusion can be drawn about this risk factor?
Listen
Risk-factor data are often presented as tables, bar charts, line graphs or scatter diagrams. Translating between forms means reading a value from a graph and writing it as a number, or plotting numerical data as a graph. Extracting information means locating the required value, such as the death rate for a given exposure. Interpreting means explaining what the pattern shows about risk, for example that as the number of cigarettes smoked per day increases, the risk of lung cancer increases. You should read axes carefully, including units and scales, and describe trends using comparative terms such as higher, lower, increases or decreases. A strong answer earns marks for these points. Reads values accurately from axes, tables or chart labels, including correct units. Translates a value from a graph into numerical form, or plots given numerical data correctly. Describes the overall trend shown, such as an increase, decrease or no clear change. Interprets the trend in terms of risk factors, linking exposure to the likelihood of a non-communicable disease. A common slip: Misreading the scale on an axis, for example treating each grid line as one unit when it represents ten. Instead, checking the labelled intervals before reading values. Exam tip: Quote figures from the graph or table to support your description, including units where given.
See it
Key words
Say what each word means before you turn the card.
Data presentation and translation
Try answering aloud or in your head before turning the card.
Graph and table interpretation
Try answering aloud or in your head before turning the card.
Risk factors and disease trends
Try answering aloud or in your head before turning the card.
Comparative analysis
Try answering aloud or in your head before turning the card.
See every definition
- Data presentation and translation
- Reading a value from a graph and writing it as a number, or plotting numerical data as a graph.
- Graph and table interpretation
- Explaining what the pattern shows about risk, for example that as the number of cigarettes smoked per day increases, the risk of lung cancer increases.
- Risk factors and disease trends
- Describing the overall trend shown, such as an increase, decrease or no clear change, in terms of risk factors.
- Comparative analysis
- Comparing data for different groups, for example smokers and non-smokers, using values from the graph or table and comparative vocabulary such as higher, lower, greater risk or reduced risk.
Label the diagram
Some boxes have lost their names. Pick the right name for each number.
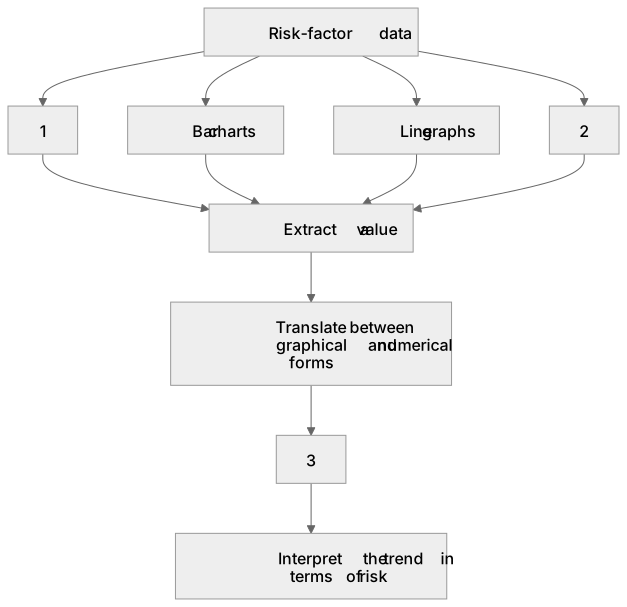
1Box 1
2Box 2
3Box 3
There is more to this lesson
The full lesson goes on to check your understanding and help you earn the marks. Create a free account to carry on, with your progress saved.
A week of Premium from your first lesson · Then the free plan continues · No card, no charge
Test your understanding of The effect of lifestyle on some non-communicable diseases: Students should be able to translate information between graphical and numerical forms; and extract and interpret information from charts, graphs and tables in terms of risk factors.
Active recall beats re-reading. Take an instant quiz now to test what you’ve learned and lock it into long-term memory.
A week of Premium from your first lesson · Then the free plan continues · No card, no charge