OCR · A-Level · Biology
Course version: H420 · Version from Sept 2025
(b) (i) genetic diagrams to show patterns of inheritance
Full specification wording
Patterns of inheritance: (b) (i) genetic diagrams to show patterns of inheritance
Genetic diagrams predict the genotypes and phenotypes of offspring from parental genotypes.
Checked against the OCR H420 specification (opens in a new tab) on .
- Point 3 of 10
- 4 key terms
Study notes
From the checked teaching notes for this specification point.
The idea
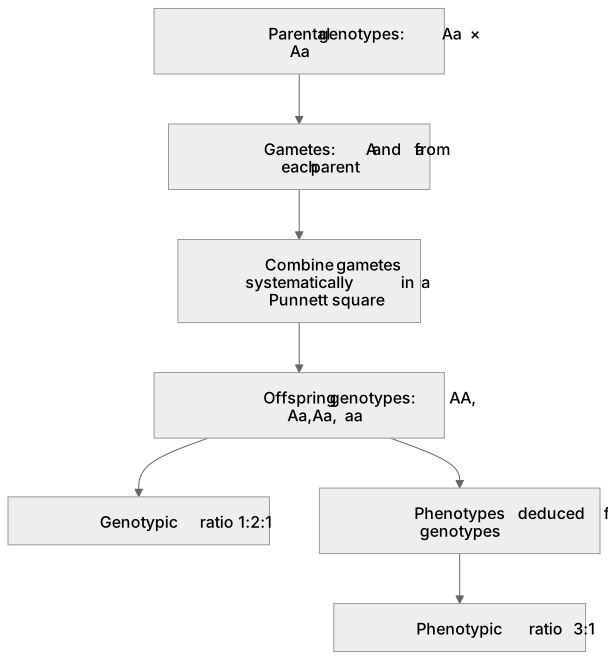
Genetic diagrams predict the genotypes and phenotypes of offspring from parental genotypes. For a monohybrid cross, assign alleles (for example A dominant, a recessive), state parental genotypes, set out gametes, then combine them in a Punnett square or cross diagram to give offspring ratios. A cross between two heterozygotes Aa × Aa gives a 3:1 phenotypic ratio and a 1:2:1 genotypic ratio. Diagrams must show gametes correctly (each gamete carries one allele) and combine them systematically. Sex linkage, codominance and multiple alleles can also be shown, adjusting the expected ratios. Multiple-choice questions test whether you can read a diagram, deduce parental genotypes or predict offspring proportions accurately.
What earns the marks
- Parental genotypes are stated using correct allele symbols, with dominant and recessive alleles distinguished.
- Gametes are shown each carrying a single allele, reflecting segregation during meiosis.
- Gametes are combined systematically in a Punnett square or cross diagram to give all possible offspring genotypes.
- Offspring genotypes and phenotypes are deduced, giving the expected ratio such as 3:1 for a heterozygous monohybrid cross.
- Codominance or sex linkage can be represented by adjusting allele symbols and expected ratios appropriately.
Common mistakes and how to put them right
Putting two alleles in a gamete.
Put it right by showing each gamete carries only one allele of a gene.
Assuming a 3:1 ratio always applies.
Put it right by checking parental genotypes, since other crosses give different ratios.
Mixing up genotype and phenotype in the diagram.
Put it right by labelling genotypes with allele symbols and phenotypes separately.
Exam tips
- Check the parental genotypes given in the stem before predicting offspring ratios.
- Confirm each gamete contains one allele, then combine systematically to avoid missing combinations.
- Match the ratio to the cross type, remembering codominance and sex linkage change expected proportions.
Try the lesson
The start of the Patterns of inheritance: (b) (i) genetic diagrams to show patterns of inheritance lesson, made from checked teaching notes for this specification point.
Have a go first
In a genetic diagram, a cross is made between a homozygous dominant tall pea plant (TT) and a homozygous recessive short plant (tt). What genotypes appear in the F1 offspring?
Listen
Genetic diagrams predict the genotypes and phenotypes of offspring from parental genotypes. For a monohybrid cross, assign alleles (for example A dominant, a recessive), state parental genotypes, set out gametes, then combine them in a Punnett square or cross diagram to give offspring ratios. A cross between two heterozygotes Aa × Aa gives a 3:1 phenotypic ratio and a 1:2:1 genotypic ratio. Diagrams must show gametes correctly (each gamete carries one allele) and combine them systematically. Sex linkage, codominance and multiple alleles can also be shown, adjusting the expected ratios. Multiple-choice questions test whether you can read a diagram, deduce parental genotypes or predict offspring proportions accurately. A strong answer earns marks for these points. Parental genotypes are stated using correct allele symbols, with dominant and recessive alleles distinguished. Gametes are shown each carrying a single allele, reflecting segregation during meiosis. Gametes are combined systematically in a Punnett square or cross diagram to give all possible offspring genotypes. Offspring genotypes and phenotypes are deduced, giving the expected ratio such as 3:1 for a heterozygous monohybrid cross. A common slip: Putting two alleles in a gamete. Instead, showing each gamete carries only one allele of a gene. Exam tip: Check the parental genotypes given in the stem before predicting offspring ratios.
See it
Key words
Say what each word means before you turn the card.
Monohybrid inheritance
Try answering aloud or in your head before turning the card.
Alleles, genotypes and phenotypes
Try answering aloud or in your head before turning the card.
Gamete formation and segregation
Try answering aloud or in your head before turning the card.
Predicting offspring ratios
Try answering aloud or in your head before turning the card.
See every definition
- Monohybrid inheritance
- A cross shown in a genetic diagram where parental genotypes are stated and gametes are combined to give offspring genotypes and phenotypes.
- Alleles, genotypes and phenotypes
- Alleles are assigned as dominant or recessive, genotypes are labelled with allele symbols, and phenotypes are labelled separately in the diagram.
- Gamete formation and segregation
- Gametes are shown each carrying a single allele, reflecting segregation during meiosis, and are combined systematically in a Punnett square or cross diagram.
- Predicting offspring ratios
- Offspring genotypes and phenotypes are deduced to give the expected ratio, such as 3:1 for a heterozygous monohybrid cross.
Label the diagram
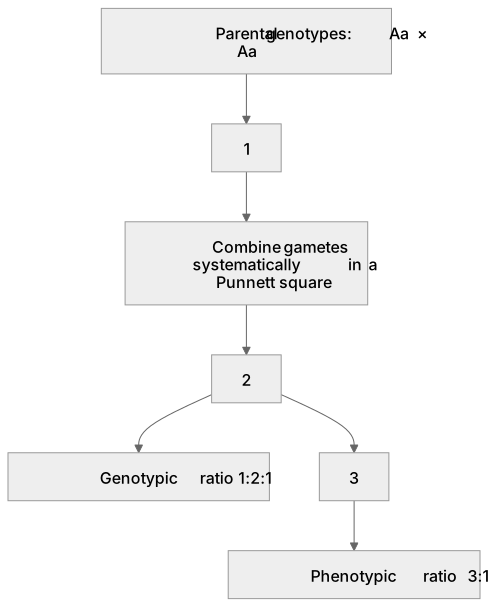
Some boxes have lost their names. Pick the right name for each number.
1Box 1
2Box 2
3Box 3
There is more to this lesson
The full lesson goes on to check your understanding and help you earn the marks. Create a free account to carry on, with your progress saved.
A week of Premium from your first lesson · Then the free plan continues · No card, no charge
Test your understanding of Patterns of inheritance: (b) (i) genetic diagrams to show patterns of inheritance
Active recall beats re-reading. Take an instant quiz now to test what you’ve learned and lock it into long-term memory.
A week of Premium from your first lesson · Then the free plan continues · No card, no charge