OCR · A-Level · Biology
Course version: H420 · Version from Sept 2025
(h) the use and interpretation of electrocardiogram (ECG) traces
Full specification wording
Transport in animals: (h) the use and interpretation of electrocardiogram (ECG) traces
An ECG records the electrical activity of the heart as a trace of voltage against time, and its use is to show the rhythm and coordination of the cardiac cycle.
Checked against the OCR H420 specification (opens in a new tab) on .
- Point 8 of 10
- 4 key terms
Study notes
From the checked teaching notes for this specification point.
The idea
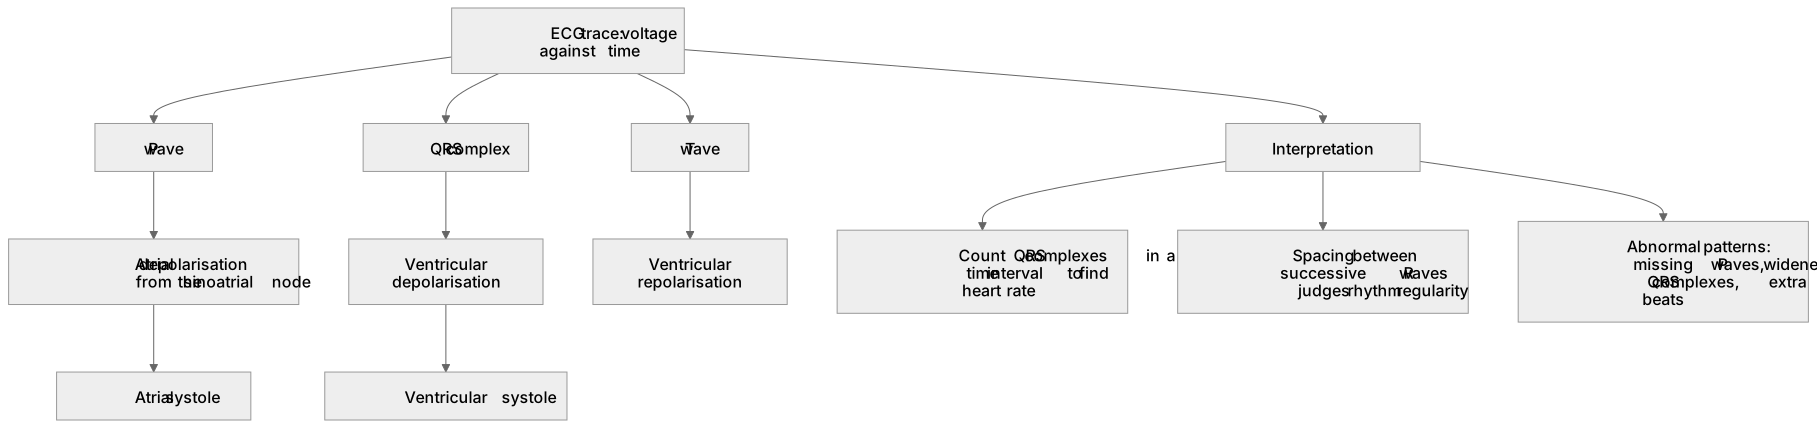
An ECG records the electrical activity of the heart as a trace of voltage against time, and its use is to show the rhythm and coordination of the cardiac cycle. A normal trace shows a P wave (atrial depolarisation spreading from the sinoatrial node, causing atrial systole), a QRS complex (ventricular depolarisation, triggering ventricular systole, which hides atrial repolarisation) and a T wave (ventricular repolarisation). Interpretation means reading the trace: counting the number of QRS complexes in a time interval to find heart rate, measuring the distance between successive R waves to judge rhythm regularity, and identifying abnormal patterns such as missing P waves, widened QRS complexes or extra beats.
For example: A trace with no clear P waves and an irregular distance between R waves indicates an abnormal rhythm rather than a normal coordinated cycle.
What earns the marks
- States that an ECG records the electrical activity of the heart plotted as voltage against time.
- Identifies the P wave as atrial depolarisation preceding atrial systole.
- Identifies the QRS complex as ventricular depolarisation triggering ventricular systole.
- Identifies the T wave as ventricular repolarisation.
- Explains that heart rate can be found by counting QRS complexes within a known time interval.
- Explains that rhythm regularity is judged from the spacing between successive R waves.
- Recognises that abnormal traces (for example absent P waves or irregular R–R spacing) indicate disrupted coordination of the cardiac cycle.
Common mistakes and how to put them right
Confusing the P wave with ventricular activity.
Put it right: The P wave represents atrial depolarisation, while the QRS complex represents ventricular depolarisation.
Treating the T wave as ventricular contraction.
Put it right: It represents ventricular repolarisation, not systole.
Assuming any ECG trace shows a normal cycle.
Put it right: Interpretation requires checking wave presence, spacing and rhythm, and abnormal patterns must be recognised.
Exam tips
- Label each wave on a trace before answering, linking it to the electrical event and the mechanical effect.
- When calculating heart rate, state the time interval used and count complete QRS complexes within it.
- For rhythm questions, compare the spacing between successive R waves rather than the height of the peaks.
Try the lesson
The start of the Transport in animals: (h) the use and interpretation of electrocardiogram (ECG) traces lesson, made from checked teaching notes for this specification point.
Have a go first
On a normal ECG trace, which wave represents the electrical activity that causes depolarisation of the atria?
Listen
An ECG records the electrical activity of the heart as a trace of voltage against time, and its use is to show the rhythm and coordination of the cardiac cycle. A normal trace shows a P wave (atrial depolarisation spreading from the sinoatrial node, causing atrial systole), a QRS complex (ventricular depolarisation, triggering ventricular systole, which hides atrial repolarisation) and a T wave (ventricular repolarisation). Interpretation means reading the trace: counting the number of QRS complexes in a time interval to find heart rate, measuring the distance between successive R waves to judge rhythm regularity, and identifying abnormal patterns such as missing P waves, widened QRS complexes or extra beats. For example, a trace with no clear P waves and an irregular distance between R waves indicates an abnormal rhythm rather than a normal coordinated cycle. A strong answer earns marks for these points. States that an ECG records the electrical activity of the heart plotted as voltage against time. Identifies the P wave as atrial depolarisation preceding atrial systole. Identifies the QRS complex as ventricular depolarisation triggering ventricular systole. Identifies the T wave as ventricular repolarisation. Exam tip: Label each wave on a trace before answering, linking it to the electrical event and the mechanical effect.
See it
Key words
Say what each word means before you turn the card.
Electrical activity of the heart
Try answering aloud or in your head before turning the card.
Coordination of the cardiac cycle
Try answering aloud or in your head before turning the card.
Waveform identification (P, QRS, T)
Try answering aloud or in your head before turning the card.
Heart rate and rhythm interpretation
Try answering aloud or in your head before turning the card.
See every definition
- Electrical activity of the heart
- An ECG records this as a trace of voltage against time, showing the rhythm and coordination of the cardiac cycle.
- Coordination of the cardiac cycle
- Shown by an ECG trace, in which a normal trace has a P wave, a QRS complex and a T wave.
- Waveform identification (P, QRS, T)
- The P wave is atrial depolarisation, the QRS complex is ventricular depolarisation and the T wave is ventricular repolarisation.
- Heart rate and rhythm interpretation
- Reading the trace by counting QRS complexes in a time interval to find heart rate and measuring the distance between successive R waves to judge rhythm regularity.
Label the diagram
Some boxes have lost their names. Pick the right name for each number.
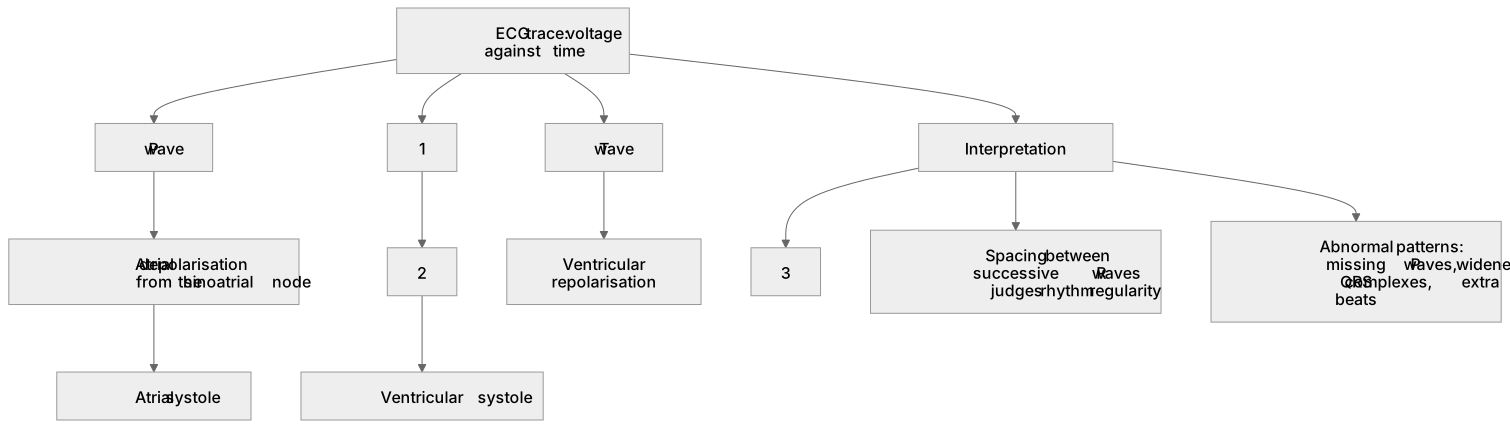
1Box 1
2Box 2
3Box 3
There is more to this lesson
The full lesson goes on to check your understanding and help you earn the marks. Create a free account to carry on, with your progress saved.
A week of Premium from your first lesson · Then the free plan continues · No card, no charge
Test your understanding of Transport in animals: (h) the use and interpretation of electrocardiogram (ECG) traces
Active recall beats re-reading. Take an instant quiz now to test what you’ve learned and lock it into long-term memory.
A week of Premium from your first lesson · Then the free plan continues · No card, no charge