AQA · GCSE · Combined Science
Course version: 8464 · Version from Sept 2018
Draw velocity–time graphs from measurements and interpret lines and slopes…
Full specification wording
Acceleration: draw velocity–time graphs from measurements and interpret lines and slopes to determine acceleration
This statement combines a practical skill with an analytical one.
Checked against the AQA 8464 specification (opens in a new tab) on .
- Point 11 of 21
- 3 key terms
Study notes
From the checked teaching notes for this specification point.
The idea
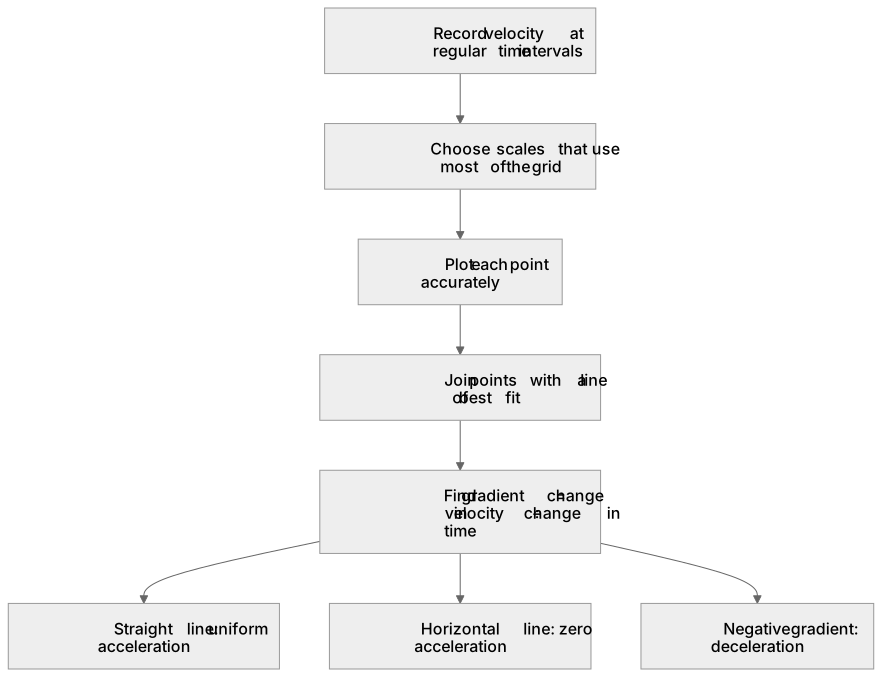
This statement combines a practical skill with an analytical one. To draw a velocity–time graph, record velocity at regular time intervals, choose scales that use most of the grid, plot each point accurately, and join points with a line of best fit. To interpret it, remember that the slope (gradient) is acceleration: gradient = change in velocity ÷ change in time, a = Δv ÷ t, in m/s². A straight line means uniform acceleration; a horizontal line means zero acceleration; a negative gradient means deceleration. For example, points (0 s, 0 m/s), (2 s, 4 m/s) and (4 s, 8 m/s) give a gradient of (8 − 0) ÷ (4 − 0) = 2 m/s². Always convert units before calculating.
What earns the marks
- Plots velocity on the vertical axis and time on the horizontal axis with correct labels and units.
- Chooses scales that spread the data across the grid and plots points accurately to within half a small square.
- Draws a line of best fit or joins points appropriately, recognising when a straight line is justified.
- Calculates acceleration from the gradient using change in velocity divided by change in time, with correct units.
- Interprets a negative gradient as deceleration and a zero gradient as constant velocity.
Common mistakes and how to put them right
Joining every point with separate straight segments when a single straight line of best fit is appropriate.
Put it right by judging whether the trend is linear.
Using the whole axis range rather than the actual data interval when finding a gradient.
Put it right by choosing two clear points on the line.
Mixing units, such as seconds with minutes or m/s with km/h.
Put it right by converting all values to SI units first.
Exam tips
- Show the two coordinate pairs you use for the gradient, then write the substitution before the answer.
- Give the unit with every calculated value and check whether the answer should be positive or negative.
Try the lesson
The start of the Acceleration: draw velocity–time graphs from measurements and interpret lines and slopes to determine acceleration lesson, made from checked teaching notes for this specification point.
Have a go first
A cyclist's velocity–time graph is a straight line from 0 m/s at 0 s to 8 m/s at 4 s. What does the slope of this line represent?
Listen
This statement combines a practical skill with an analytical one. To draw a velocity–time graph, record velocity at regular time intervals, choose scales that use most of the grid, plot each point accurately, and join points with a line of best fit. To interpret it, remember that the slope (gradient) is acceleration: gradient = change in velocity ÷ change in time, a = Δv ÷ t, in m/s². A straight line means uniform acceleration; a horizontal line means zero acceleration; a negative gradient means deceleration. For example, points (0 s, 0 m/s), (2 s, 4 m/s) and (4 s, 8 m/s) give a gradient of (8 − 0) ÷ (4 − 0) = 2 m/s². Always convert units before calculating. A strong answer earns marks for these points. Plots velocity on the vertical axis and time on the horizontal axis with correct labels and units. Chooses scales that spread the data across the grid and plots points accurately to within half a small square. Draws a line of best fit or joins points appropriately, recognising when a straight line is justified. Calculates acceleration from the gradient using change in velocity divided by change in time, with correct units. A common slip: Joining every point with separate straight segments when a single straight line of best fit is appropriate. Instead, judging whether the trend is linear. Exam tip: Show the two coordinate pairs you use for the gradient, then write the substitution before the answer.
See it
Key words
Say what each word means before you turn the card.
Line of best fit
Try answering aloud or in your head before turning the card.
Gradient as acceleration
Try answering aloud or in your head before turning the card.
Plotting from measurements
Try answering aloud or in your head before turning the card.
See every definition
- Line of best fit
- A line drawn through plotted points that shows the trend, used when a straight line is justified.
- Gradient as acceleration
- The slope of a velocity–time graph, found as change in velocity divided by change in time, in m/s².
- Plotting from measurements
- Recording velocity at regular time intervals, choosing scales that use most of the grid, and plotting each point accurately.
Label the diagram
Some boxes have lost their names. Pick the right name for each number.
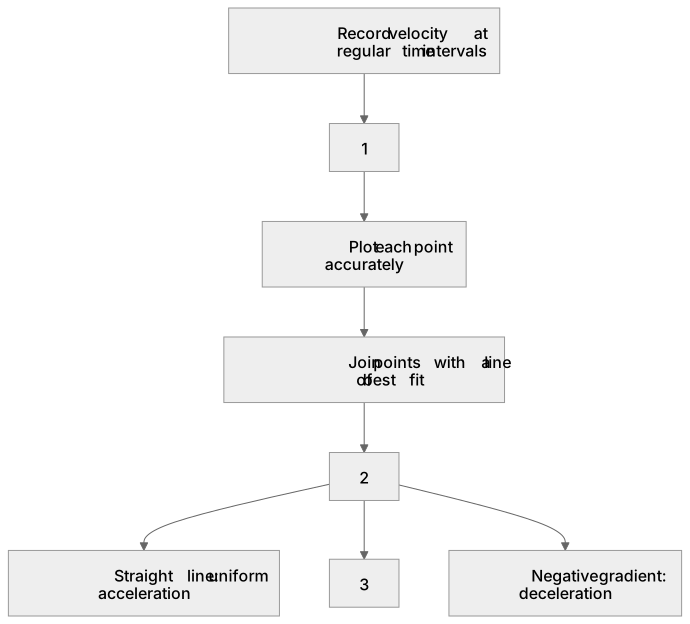
1Box 1
2Box 2
3Box 3
There is more to this lesson
The full lesson goes on to check your understanding and help you earn the marks. Create a free account to carry on, with your progress saved.
A week of Premium from your first lesson · Then the free plan continues · No card, no charge
Test your understanding of Acceleration: draw velocity–time graphs from measurements and interpret lines and slopes to determine acceleration
Active recall beats re-reading. Take an instant quiz now to test what you’ve learned and lock it into long-term memory.
A week of Premium from your first lesson · Then the free plan continues · No card, no charge