AQA · GCSE · Combined Science
Course version: 8464 · Version from Sept 2018
(HT only) interpret enclosed areas in velocity–time graphs to determine…
Full specification wording
Acceleration: (HT only) interpret enclosed areas in velocity–time graphs to determine distance travelled (or displacement)
On a velocity–time graph, the area between the plotted line and the time axis represents the distance travelled, or displacement when direction is included.
Checked against the AQA 8464 specification (opens in a new tab) on .
- Point 12 of 21
Study notes
From the checked teaching notes for this specification point.
The idea
On a velocity–time graph, the area between the plotted line and the time axis represents the distance travelled, or displacement when direction is included. This specific skill is assessed at Higher Tier only. Split the enclosed region into rectangles, triangles or trapezia, calculate each area, then add them. For example, a line rising from 0 m/s to 8 m/s over 4 s forms a triangle: area = ½ × 4 s × 8 m/s = 16 m. A constant 8 m/s for the next 3 s forms a rectangle: 8 m/s × 3 s = 24 m, giving 40 m in total. Areas below the time axis count as negative displacement, so subtract them when displacement is required. Always attach the unit metre (m) and check the axes' scales before calculating.
What earns the marks
- States that the area between the velocity–time line and the time axis represents distance travelled, or displacement if direction is considered.
- Splits a compound enclosed region into standard shapes such as rectangles, triangles and trapezia before calculating.
- Uses area formulae correctly, for example ½ × base × height for a triangle and base × height for a rectangle, with consistent units.
- Adds component areas for total distance and subtracts areas below the time axis when determining displacement.
- Gives the final answer with the correct unit, such as m, and a sensible magnitude for the graph scale.
Common mistakes and how to put them right
Reading the gradient instead of the area.
Put it right: The gradient gives acceleration, whereas the enclosed area gives distance or displacement.
Forgetting the factor ½ in a triangular region, which doubles the calculated distance.
Put it right: Write the formula before substituting.
Treating an area below the time axis as positive when displacement is required.
Put it right: Such regions represent motion in the opposite direction and must be subtracted.
Exam tips
- Lightly shade the enclosed region and label each simple shape before doing any arithmetic.
- Write the area formula, then substitute values with units, so method marks are visible even if the final number is wrong.
Try the lesson
The start of the Acceleration: (HT only) interpret enclosed areas in velocity–time graphs to determine distance travelled (or displacement) lesson, made from checked teaching notes for this specification point.
Have a go first
A car accelerates uniformly from rest to 12 m/s in 8 s. The velocity–time graph is a straight line from the origin to (8 s, 12 m/s). Use the area under the graph to find the distance travelled during the 8 s.
Listen
On a velocity–time graph, the area between the plotted line and the time axis represents the distance travelled, or displacement when direction is included. This specific skill is assessed at Higher Tier only. Split the enclosed region into rectangles, triangles or trapezia, calculate each area, then add them. For example, a line rising from 0 m/s to 8 m/s over 4 s forms a triangle: area = ½ × 4 s × 8 m/s = 16 m. A constant 8 m/s for the next 3 s forms a rectangle: 8 m/s × 3 s = 24 m, giving 40 m in total. Areas below the time axis count as negative displacement, so subtract them when displacement is required. Always attach the unit metre (m) and check the axes' scales before calculating. A strong answer earns marks for these points. States that the area between the velocity–time line and the time axis represents distance travelled, or displacement if direction is considered. Splits a compound enclosed region into standard shapes such as rectangles, triangles and trapezia before calculating. Uses area formulae correctly, for example ½ × base × height for a triangle and base × height for a rectangle, with consistent units. Adds component areas for total distance and subtracts areas below the time axis when determining displacement. Exam tip: Lightly shade the enclosed region and label each simple shape before doing any arithmetic.
See it
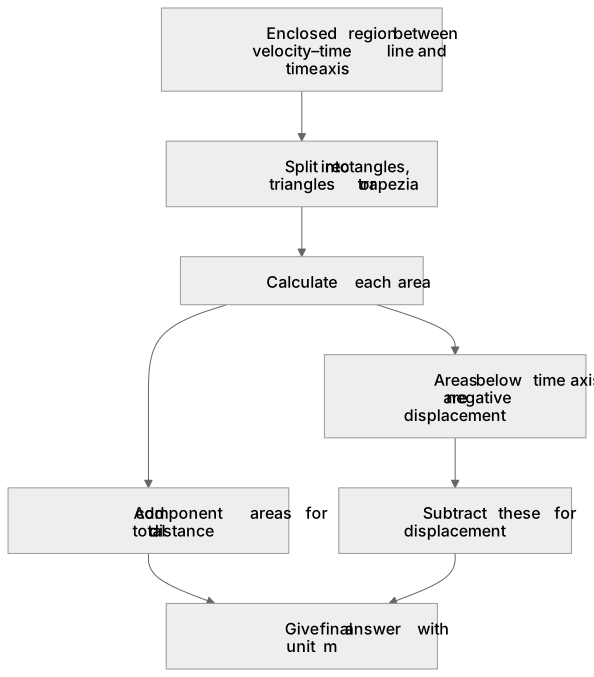
Label the diagram
Some boxes have lost their names. Pick the right name for each number.
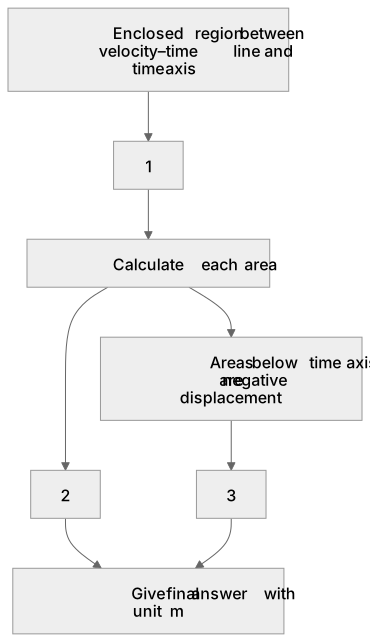
1Box 1
2Box 2
3Box 3
There is more to this lesson
The full lesson goes on to check your understanding and help you earn the marks. Create a free account to carry on, with your progress saved.
A week of Premium from your first lesson · Then the free plan continues · No card, no charge
Test your understanding of Acceleration: (HT only) interpret enclosed areas in velocity–time graphs to determine distance travelled (or displacement)
Active recall beats re-reading. Take an instant quiz now to test what you’ve learned and lock it into long-term memory.
A week of Premium from your first lesson · Then the free plan continues · No card, no charge