AQA · GCSE · Combined Science
Course version: 8464 · Version from Sept 2018
(HT only) measure, when appropriate, the area under a velocity–time graph…
Full specification wording
Acceleration: (HT only) measure, when appropriate, the area under a velocity–time graph by counting squares.
When a velocity–time graph has a curved line or an irregular shape, the enclosed area represents the distance travelled.
Checked against the AQA 8464 specification (opens in a new tab) on .
- Point 13 of 21
- 3 key terms
Study notes
From the checked teaching notes for this specification point.
The idea
When a velocity–time graph has a curved line or an irregular shape, the enclosed area represents the distance travelled. For Higher Tier students, this area can be estimated by counting squares on the grid. First, determine what one square represents: multiply the time interval per square by the velocity interval per square (e.g., 0.5 s × 2 m/s = 1 m). Count whole squares inside the region, then combine part-squares to make whole ones. Multiply the total number of squares by the value of one square to estimate the distance. This method gives an approximate value. Counting squares is especially useful when the line is not straight and no simple area formula applies.
What earns the marks
- Determines the value represented by one grid square by multiplying the time interval per square by the velocity interval per square.
- Counts whole squares enclosed by the line and the time axis accurately.
- Combines partial squares sensibly, for example pairing parts that together make approximately one whole square.
- Multiplies the total number of squares by the value of one square and gives the result with the unit m.
- Recognises that counting squares gives an estimate and communicates the answer as approximate where appropriate.
Common mistakes and how to put them right
Using only the number of squares along one axis rather than the area of each square.
Put it right: Calculate the value of one square using both axis intervals.
Counting squares outside the enclosed region or missing part-squares near the line.
Put it right: Mark the boundary clearly before counting.
Giving an exact-looking answer without acknowledging that counting squares is an estimate.
Put it right: State that the value is approximate.
Exam tips
- As a Higher Tier candidate, be prepared to estimate the area under a curved velocity-time graph by counting squares, as simple geometry formulas will not work.
- Annotate the graph by writing the value of one square, such as 1 square = 1 m, before counting.
- Count systematically in rows or columns and tick each square as you count to avoid double-counting.
- Show your total square count and the multiplication by the square value so the method is clear.
Try the lesson
The start of the Acceleration: (HT only) measure, when appropriate, the area under a velocity–time graph by counting squares. lesson, made from checked teaching notes for this specification point.
Have a go first
On a velocity–time graph, each square represents 5 m/s on the velocity axis and 2 s on the time axis. What distance does one square represent?
Listen
When a velocity–time graph has a curved line or an irregular shape, the enclosed area represents the distance travelled. For Higher Tier students, this area can be estimated by counting squares on the grid. First, determine what one square represents: multiply the time interval per square by the velocity interval per square (e.g., 0.5 s × 2 m/s = 1 m). Count whole squares inside the region, then combine part-squares to make whole ones. Multiply the total number of squares by the value of one square to estimate the distance. This method gives an approximate value. Counting squares is especially useful when the line is not straight and no simple area formula applies. A strong answer earns marks for these points. Determines the value represented by one grid square by multiplying the time interval per square by the velocity interval per square. Counts whole squares enclosed by the line and the time axis accurately. Combines partial squares sensibly, for example pairing parts that together make approximately one whole square. Multiplies the total number of squares by the value of one square and gives the result with the unit m. Exam tip: As a Higher Tier candidate, be prepared to estimate the area under a curved velocity-time graph by counting squares, as simple geometry formulas will not work.
See it
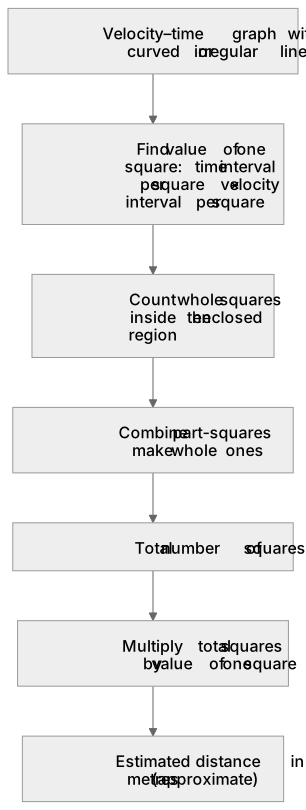
Put it in order
Put these steps in the order they happen.
- 1. Estimated distance in metres (approximate)
- 2. Multiply total squares by value of one square
- 3. Count whole squares inside the enclosed region
- 4. Total number of squares
- 5. Velocity–time graph with curved or irregular line
- 6. Find value of one square: time interval per square × velocity interval per square
- 7. Combine part-squares to make whole ones
Key words
Say what each word means before you turn the card.
Area under a curve
Try answering aloud or in your head before turning the card.
Graphical estimation
Try answering aloud or in your head before turning the card.
Scale interpretation
Try answering aloud or in your head before turning the card.
See every definition
- Area under a curve
- The enclosed area on a velocity–time graph with a curved line or irregular shape, representing the distance travelled.
- Graphical estimation
- Counting squares on the grid to estimate the area under a velocity–time graph, giving an approximate value.
- Scale interpretation
- Determining what one square represents by multiplying the time interval per square by the velocity interval per square.
Label the diagram
Some boxes have lost their names. Pick the right name for each number.
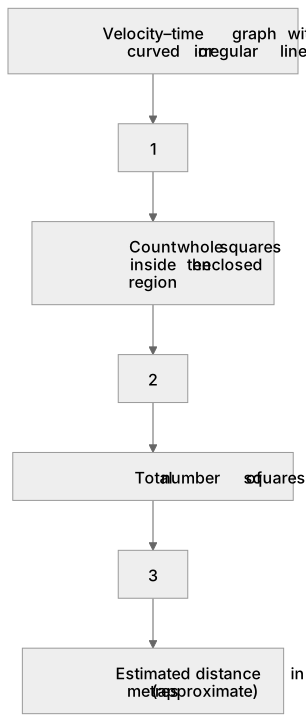
1Box 1
2Box 2
3Box 3
There is more to this lesson
The full lesson goes on to check your understanding and help you earn the marks. Create a free account to carry on, with your progress saved.
A week of Premium from your first lesson · Then the free plan continues · No card, no charge
Test your understanding of Acceleration: (HT only) measure, when appropriate, the area under a velocity–time graph by counting squares.
Active recall beats re-reading. Take an instant quiz now to test what you’ve learned and lock it into long-term memory.
A week of Premium from your first lesson · Then the free plan continues · No card, no charge