AQA · GCSE · Combined Science
Course version: 8464 · Version from Sept 2018
(HT only) Students should be able to explain graphs of photosynthesis rate…
Full specification wording
Rate of photosynthesis: (HT only) Students should be able to explain graphs of photosynthesis rate involving two or three factors and decide which is the limiting factor.
Photosynthesis rate depends on light intensity, carbon dioxide concentration and temperature.
Checked against the AQA 8464 specification (opens in a new tab) on .
- Point 7 of 10
- 3 key terms
Study notes
From the checked teaching notes for this specification point.
The idea
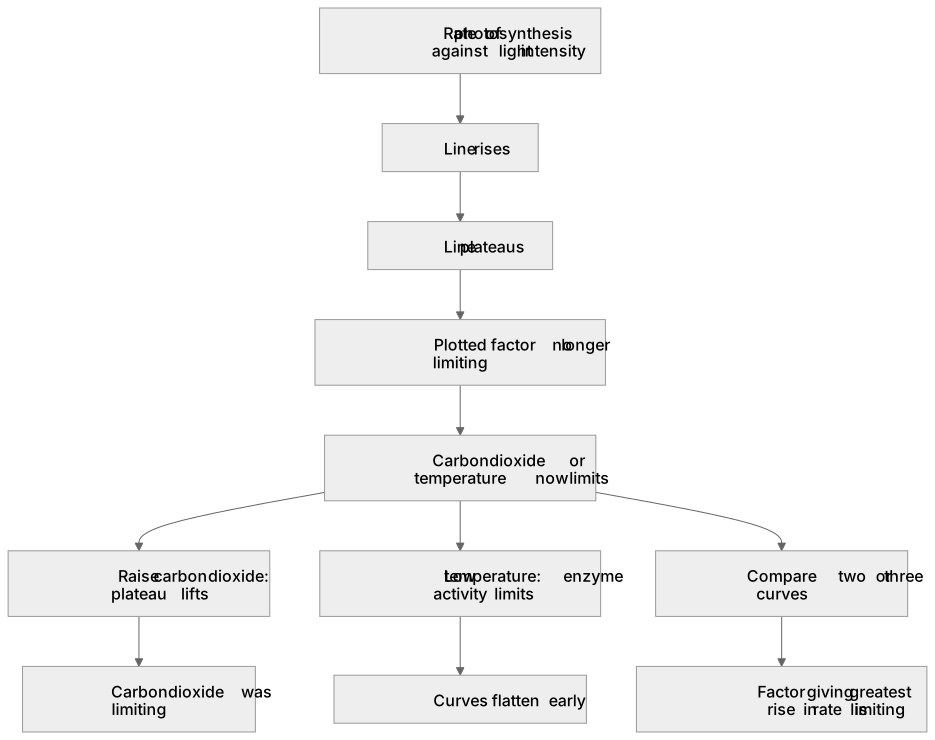
Photosynthesis rate depends on light intensity, carbon dioxide concentration and temperature. When one factor is in short supply it limits the rate; increasing it raises the rate until another factor becomes limiting. On a graph of rate against light intensity, the line rises then plateaus. The plateau shows light is no longer limiting, so carbon dioxide or temperature now limits. If raising carbon dioxide lifts the plateau, carbon dioxide was limiting. With two or three factors plotted, compare the curves: the factor whose increase produces the greatest rise is limiting. At low temperature, enzyme activity limits, so curves flatten early. Decide the limiting factor by identifying which change increases the rate.
What earns the marks
- State that the limiting factor is the factor in shortest supply that restricts the rate of photosynthesis.
- Describe how a plateau on a rate graph shows that the plotted factor is no longer limiting.
- Explain that increasing carbon dioxide concentration can raise a light-intensity plateau, showing carbon dioxide was limiting.
- Use enzyme activity to explain why low temperature limits the rate even when light and carbon dioxide are plentiful.
- Compare two or three curves to identify which changed factor gives the greatest increase in rate and is therefore limiting.
Common mistakes and how to put them right
Thinking the plateau means photosynthesis has stopped.
Put it right by stating the rate is constant because another factor is now limiting.
Assuming light is always limiting at high light intensity.
Put it right by checking whether another factor, such as carbon dioxide or temperature, limits the plateau.
Ignoring temperature when comparing curves.
Put it right by noting that low temperature reduces enzyme activity and can limit the rate before light or carbon dioxide.
Exam tips
- Label each curve clearly with the factor changed, such as light intensity at 0.04% and 0.4% carbon dioxide.
- As this is Higher Tier only content, when asked to decide the limiting factor, state the evidence from the graph, for example the rate rises when carbon dioxide increases.
Try the lesson
The start of the Rate of photosynthesis: (HT only) Students should be able to explain graphs of photosynthesis rate involving two or three factors and decide which is the limiting factor. lesson, made from checked teaching notes for this specification point.
Have a go first
When interpreting a graph of photosynthesis rate against light intensity, what does a horizontal, levelled-off section of the curve indicate about the limiting factors?
Listen
Photosynthesis rate depends on light intensity, carbon dioxide concentration and temperature. When one factor is in short supply it limits the rate; increasing it raises the rate until another factor becomes limiting. On a graph of rate against light intensity, the line rises then plateaus. The plateau shows light is no longer limiting, so carbon dioxide or temperature now limits. If raising carbon dioxide lifts the plateau, carbon dioxide was limiting. With two or three factors plotted, compare the curves: the factor whose increase produces the greatest rise is limiting. At low temperature, enzyme activity limits, so curves flatten early. Decide the limiting factor by identifying which change increases the rate. A strong answer earns marks for these points. State that the limiting factor is the factor in shortest supply that restricts the rate of photosynthesis. Describe how a plateau on a rate graph shows that the plotted factor is no longer limiting. Explain that increasing carbon dioxide concentration can raise a light-intensity plateau, showing carbon dioxide was limiting. Use enzyme activity to explain why low temperature limits the rate even when light and carbon dioxide are plentiful. A common slip: Thinking the plateau means photosynthesis has stopped. Instead, stating the rate is constant because another factor is now limiting. Exam tip: Label each curve clearly with the factor changed, such as light intensity at 0.04% and 0.4% carbon dioxide.
See it
Key words
Say what each word means before you turn the card.
Limiting factor
Try answering aloud or in your head before turning the card.
Rate of photosynthesis
Try answering aloud or in your head before turning the card.
Graph interpretation
Try answering aloud or in your head before turning the card.
See every definition
- Limiting factor
- The factor in shortest supply that restricts the rate of photosynthesis.
- Rate of photosynthesis
- A measure that depends on light intensity, carbon dioxide concentration and temperature, and is raised by increasing a factor until another becomes limiting.
- Graph interpretation
- Comparing curves of rate against a factor to identify which changed factor gives the greatest increase in rate and is therefore limiting.
Label the diagram
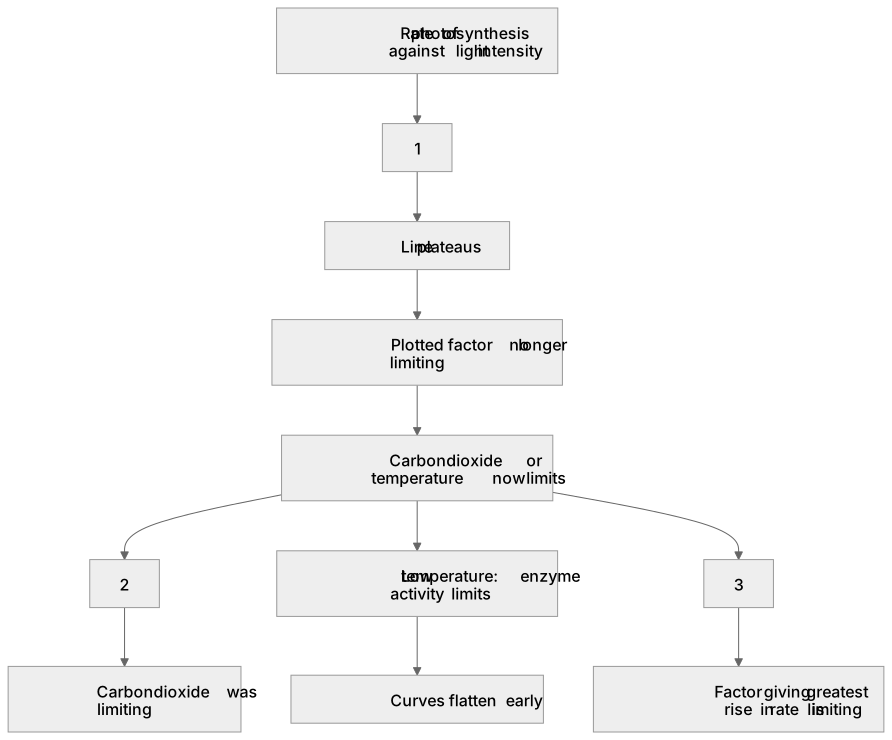
Some boxes have lost their names. Pick the right name for each number.
1Box 1
2Box 2
3Box 3
There is more to this lesson
The full lesson goes on to check your understanding and help you earn the marks. Create a free account to carry on, with your progress saved.
A week of Premium from your first lesson · Then the free plan continues · No card, no charge
Test your understanding of Rate of photosynthesis: (HT only) Students should be able to explain graphs of photosynthesis rate involving two or three factors and decide which is the limiting factor.
Active recall beats re-reading. Take an instant quiz now to test what you’ve learned and lock it into long-term memory.
A week of Premium from your first lesson · Then the free plan continues · No card, no charge