AQA · A-Level · Geography
Course version: 7037 · Version from Sept 2018
Graphical skills: Scatter graphs, and the use of best fit line.
Scatter graphs plot paired numerical data to investigate the correlation between two continuous variables, such as GDP per capita and life expectancy.
Checked against the AQA 7037 specification (opens in a new tab) on .
- Point 3 of 7
- 4 key terms
Study notes
From the checked teaching notes for this specification point.
The idea
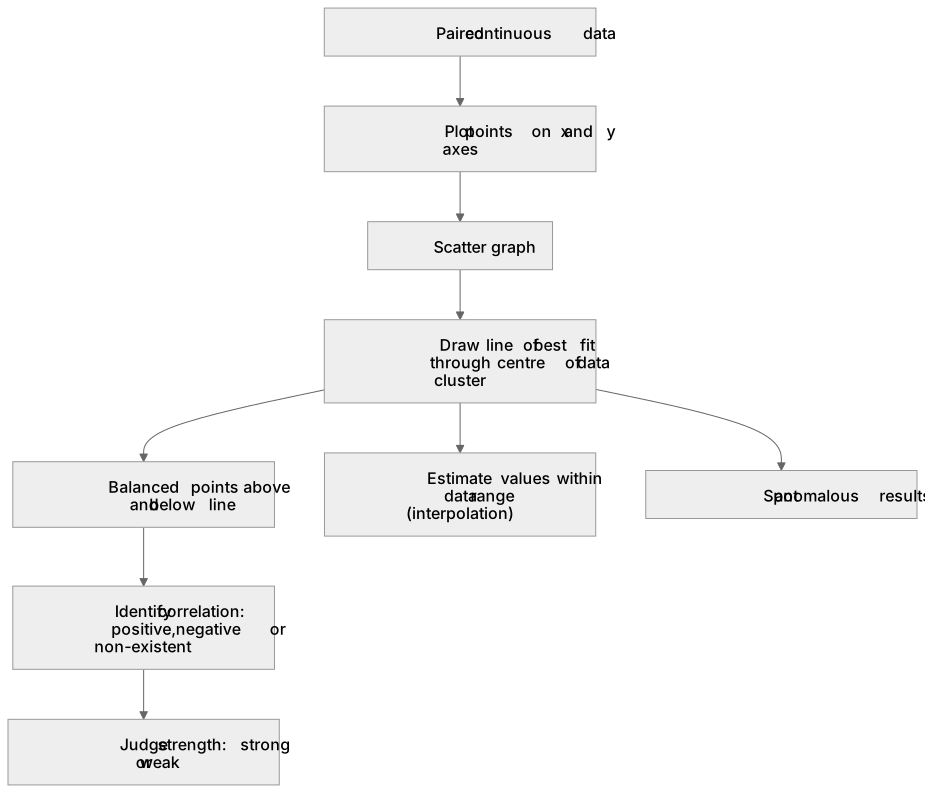
Scatter graphs plot paired numerical data to investigate the correlation between two continuous variables, such as GDP per capita and life expectancy. Each point represents a single observation on the x and y axes. A line of best fit is drawn through the centre of the data cluster to visually represent the trend, ensuring a roughly equal number of points lie above and below the line. This line identifies whether the correlation is positive, negative, or non-existent, and indicates relationship strength based on how closely points cluster around it. The line of best fit is also used to estimate values within the data range (interpolation) and to spot anomalous results that deviate significantly from the general trend.
What earns the marks
- Plotting coordinates accurately on both the x and y axes to form a scatter graph.
- Drawing a valid line of best fit that follows the general trend of the data with balanced points on either side.
- Interpreting the type (positive/negative) and strength (strong/weak) of correlation shown by the scatter graph.
- Identifying anomalies or outliers that do not conform to the pattern established by the line of best fit.
Common mistakes and how to put them right
Forcing the line of best fit to pass through the origin (0,0) regardless of the data trend.
Put it right: Draw the line through the centre of the data points, which may not necessarily intersect the origin.
Connecting the dots in a zig-zag pattern instead of drawing a single straight or smoothly curved line of best fit.
Put it right: Draw one continuous line that represents the overall trend of the scatter plot.
Assuming that a strong correlation on a scatter graph proves causation between the two variables.
Put it right: State that the graph shows a relationship or correlation, but acknowledge that other factors may cause the trend.
Exam tips
- When drawing a line of best fit, use a clear ruler so you can see the data points underneath and balance them evenly on both sides.
- Always quote specific data coordinates from the scatter graph when describing the overall trend or identifying an anomaly.
- If asked to estimate a value, draw lines from the given axis to your line of best fit, and then across to the other axis to read the result.
Try the lesson
The start of the Graphical skills: Scatter graphs, and the use of best fit line. lesson, made from checked teaching notes for this specification point.
Have a go first
A student is investigating the relationship between Gross Domestic Product (GDP) per capita and life expectancy for twenty different countries. Why is a scatter graph the most appropriate graphical technique for this investigation?
Listen
Scatter graphs plot paired numerical data to investigate the correlation between two continuous variables, such as GDP per capita and life expectancy. Each point represents a single observation on the x and y axes. A line of best fit is drawn through the centre of the data cluster to visually represent the trend, ensuring a roughly equal number of points lie above and below the line. This line identifies whether the correlation is positive, negative, or non-existent, and indicates relationship strength based on how closely points cluster around it. The line of best fit is also used to estimate values within the data range (interpolation) and to spot anomalous results that deviate significantly from the general trend. A strong answer earns marks for these points. Plotting coordinates accurately on both the x and y axes to form a scatter graph. Drawing a valid line of best fit that follows the general trend of the data with balanced points on either side. Interpreting the type (positive/negative) and strength (strong/weak) of correlation shown by the scatter graph. Identifying anomalies or outliers that do not conform to the pattern established by the line of best fit. A common slip: Forcing the line of best fit to pass through the origin (0,0) regardless of the data trend. Instead, Draw the line through the centre of the data points, which may not necessarily intersect the origin. Exam tip: When drawing a line of best fit, use a clear ruler so you can see the data points underneath and balance them evenly on both sides.
See it
Key words
Say what each word means before you turn the card.
Scatter graphs
Try answering aloud or in your head before turning the card.
Line of best fit
Try answering aloud or in your head before turning the card.
Correlation
Try answering aloud or in your head before turning the card.
Interpolation
Try answering aloud or in your head before turning the card.
See every definition
- Scatter graphs
- Graphs that plot paired numerical data to investigate the correlation between two continuous variables, with each point representing a single observation on the x and y axes.
- Line of best fit
- A line drawn through the centre of the data cluster to visually represent the trend, ensuring a roughly equal number of points lie above and below the line.
- Correlation
- Whether the relationship shown is positive, negative, or non-existent, with strength indicated by how closely points cluster around the line of best fit.
- Interpolation
- Using the line of best fit to estimate values within the data range.
Label the diagram
Some boxes have lost their names. Pick the right name for each number.
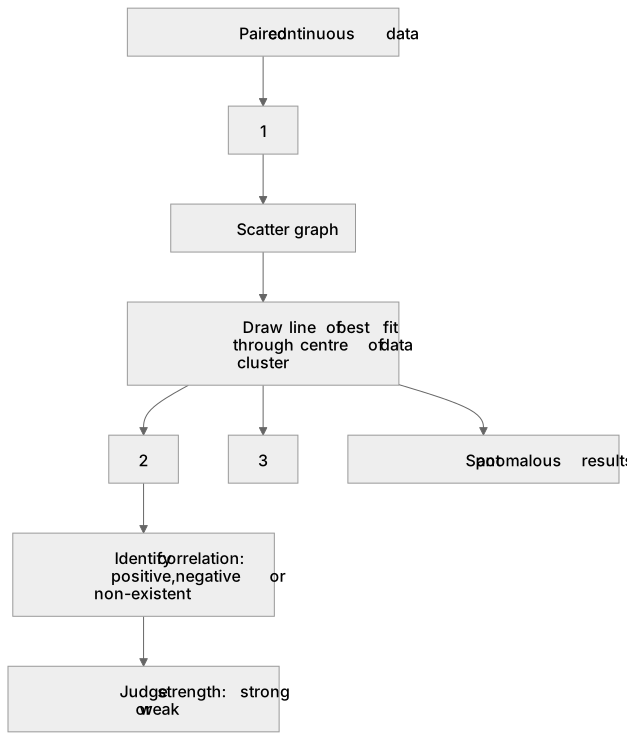
1Box 1
2Box 2
3Box 3
There is more to this lesson
The full lesson goes on to check your understanding and help you earn the marks. Create a free account to carry on, with your progress saved.
A week of Premium from your first lesson · Then the free plan continues · No card, no charge
Test your understanding of Graphical skills: Scatter graphs, and the use of best fit line.
Active recall beats re-reading. Take an instant quiz now to test what you’ve learned and lock it into long-term memory.
A week of Premium from your first lesson · Then the free plan continues · No card, no charge