AQA · A-Level · Geography
Course version: 7037 · Version from Sept 2018
Graphical skills: Graphs with logarithmic scales.
Logarithmic scales are essential in geography for plotting data that spans several orders of magnitude on a single axis.
Checked against the AQA 7037 specification (opens in a new tab) on .
- Point 6 of 7
Study notes
From the checked teaching notes for this specification point.
The idea
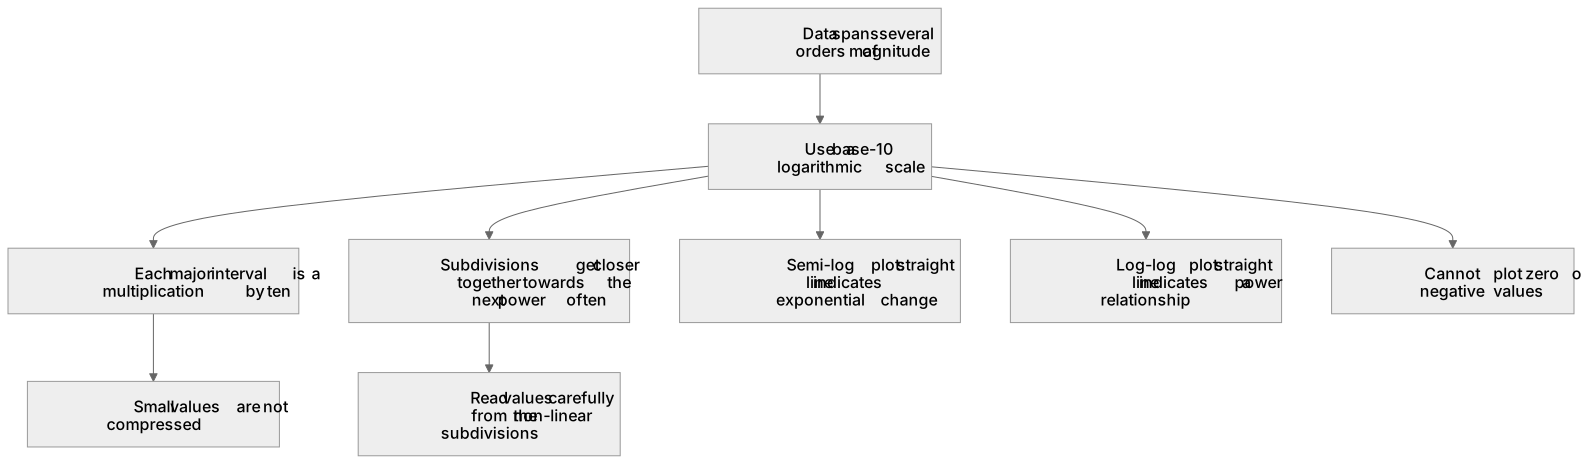
Logarithmic scales are essential in geography for plotting data that spans several orders of magnitude on a single axis. Unlike linear scales, where each interval represents a constant addition, each major interval on a base-10 logarithmic scale represents a multiplication by ten (for example, 1, 10, 100, 1000). This prevents small values from being compressed and unreadable when plotted alongside extremely large values. A classic geographical application is the Hjulström curve, which uses logarithmic scales for particle size (in mm) and water velocity (in cm s⁻¹) to show the relationship between river flow and sediment transport.
What earns the marks
- Identify when a logarithmic scale is appropriate, such as when data spans multiple orders of magnitude.
- Accurately read values from a logarithmic axis, noting the unequal spacing of subdivisions between major intervals.
- Plot data points correctly on semi-logarithmic or log-log graphs, such as the Hjulström curve or flood frequency graphs.
- Interpret relationships with the graph type stated: a straight line on a semi-log plot with a logarithmic y-axis can indicate exponential change, while a straight line on a log-log plot indicates a power relationship.
Common mistakes and how to put them right
Assuming the subdivisions between major logarithmic intervals (e.g., between 10 and 100) are equally spaced.
Put it right: Recognise that subdivisions get progressively closer together as the value approaches the next power of ten.
Reading a value halfway between 10 and 100 as 55.
Put it right: Understand that the midpoint on a logarithmic scale represents a geometric mean, so the physical halfway point is closer to 31.6, and the line for 50 is further up the axis.
Attempting to plot zero or negative values on a standard logarithmic scale.
Put it right: The logarithm of zero is undefined; logarithmic scales typically start at a small positive number like 0.1 or 1.
Exam tips
- Always check the axis labels carefully to determine if the scale is base-10 logarithmic before reading any data points.
- When plotting points, use the minor grid lines carefully, remembering they represent 20, 30, 40 etc., not linear increments.
- Use a clear ruler to trace across from the axis to the data point to avoid misreading the non-linear subdivisions.
Try the lesson
The start of the Graphical skills: Graphs with logarithmic scales. lesson, made from checked teaching notes for this specification point.
Have a go first
Which of the following best describes the primary advantage of using a logarithmic scale on a graph in geographical data presentation?
Listen
Logarithmic scales are essential in geography for plotting data that spans several orders of magnitude on a single axis. Unlike linear scales, where each interval represents a constant addition, each major interval on a base-10 logarithmic scale represents a multiplication by ten (for example, 1, 10, 100, 1000). This prevents small values from being compressed and unreadable when plotted alongside extremely large values. A classic geographical application is the Hjulström curve, which uses logarithmic scales for particle size (in mm) and water velocity (in cm s⁻¹) to show the relationship between river flow and sediment transport. A strong answer earns marks for these points. Identify when a logarithmic scale is appropriate, such as when data spans multiple orders of magnitude. Accurately read values from a logarithmic axis, noting the unequal spacing of subdivisions between major intervals. Plot data points correctly on semi-logarithmic or log-log graphs, such as the Hjulström curve or flood frequency graphs. Interpret relationships with the graph type stated: a straight line on a semi-log plot with a logarithmic y-axis can indicate exponential change, while a straight line on a log-log plot indicates a power relationship. A common slip: Assuming the subdivisions between major logarithmic intervals (e.g., between 10 and 100) are equally spaced. Instead, Recognise that subdivisions get progressively closer together as the value approaches the next power of ten. Exam tip: Always check the axis labels carefully to determine if the scale is base-10 logarithmic before reading any data points.
See it
Label the diagram
Some boxes have lost their names. Pick the right name for each number.
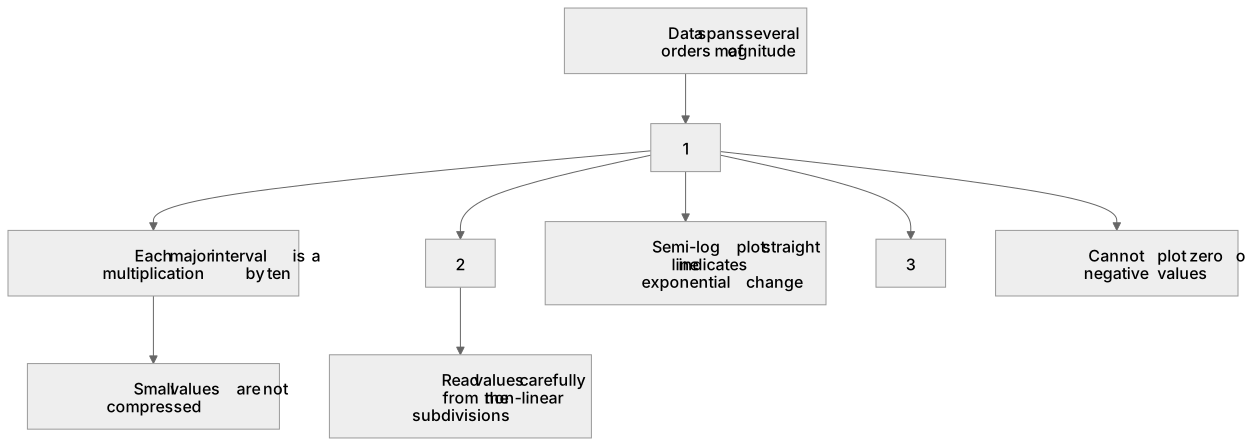
1Box 1
2Box 2
3Box 3
There is more to this lesson
The full lesson goes on to check your understanding and help you earn the marks. Create a free account to carry on, with your progress saved.
A week of Premium from your first lesson · Then the free plan continues · No card, no charge
Test your understanding of Graphical skills: Graphs with logarithmic scales.
Active recall beats re-reading. Take an instant quiz now to test what you’ve learned and lock it into long-term memory.
A week of Premium from your first lesson · Then the free plan continues · No card, no charge