AQA · A-Level · Geography
Course version: 7037 · Version from Sept 2018
Graphical skills: Triangular graphs.
Triangular graphs display data divided into three components that collectively sum to exactly 100%.
Checked against the AQA 7037 specification (opens in a new tab) on .
- Point 5 of 7
Study notes
From the checked teaching notes for this specification point.
The idea
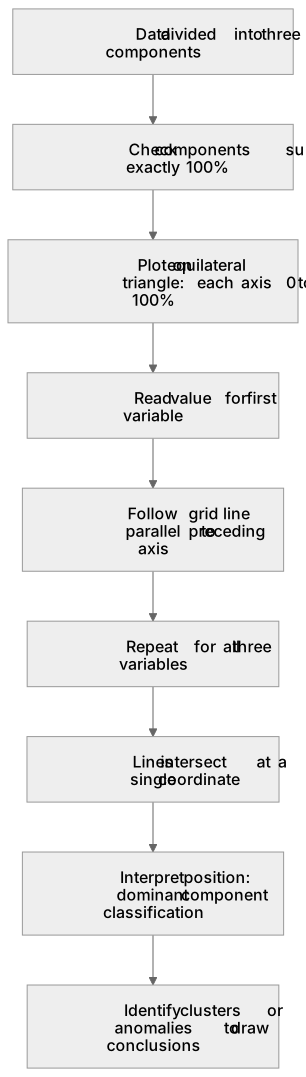
Triangular graphs display data divided into three components that collectively sum to exactly 100%. They are plotted on an equilateral triangle where each axis represents a percentage from 0 to 100. This method is highly effective for classifying geographical phenomena based on composition, such as soil textures (percentages of sand, silt, and clay) or employment structures (primary, secondary, and tertiary sectors). To plot a point, read the value for the first variable and follow the grid line parallel to the preceding axis, repeating this for all three variables until they intersect at a single coordinate. This allows rapid visual comparison of multiple datasets, highlighting clustering within complex three-part systems.
What earns the marks
- Verifying that the three variables for each data point sum to exactly 100% before attempting to plot.
- Accurately reading and plotting coordinates by following the grid lines parallel to the correct zero-axis.
- Interpreting the position of a plotted point to determine the dominant component or classification.
- Identifying clusters or anomalies within a set of plotted points to draw conclusions about geographical patterns.
Common mistakes and how to put them right
Following the grid lines in the wrong direction.
Put it right by tracing the line parallel to the axis that represents 0% for that specific variable.
Attempting to plot data that does not sum to 100%.
Put it right by converting raw data into percentages of the total before plotting.
Misinterpreting the axes by reading the numbers in reverse.
Put it right by checking the direction of the numbers along each specific axis.
Exam tips
- Use a ruler to trace the grid lines from each axis to ensure your point is plotted at the exact intersection of all three values.
- Check your plotted point by reading the three values back from the graph to confirm they match your original data and sum to 100%.
- When analysing a triangular graph, look for clusters of points to identify common characteristics or trends within the dataset.
Try the lesson
The start of the Graphical skills: Triangular graphs. lesson, made from checked teaching notes for this specification point.
Have a go first
What type of data is most appropriate to display on a triangular graph?
Listen
Triangular graphs display data divided into three components that collectively sum to exactly 100%. They are plotted on an equilateral triangle where each axis represents a percentage from 0 to 100. This method is highly effective for classifying geographical phenomena based on composition, such as soil textures (percentages of sand, silt, and clay) or employment structures (primary, secondary, and tertiary sectors). To plot a point, read the value for the first variable and follow the grid line parallel to the preceding axis, repeating this for all three variables until they intersect at a single coordinate. This allows rapid visual comparison of multiple datasets, highlighting clustering within complex three-part systems. A strong answer earns marks for these points. Verifying that the three variables for each data point sum to exactly 100% before attempting to plot. Accurately reading and plotting coordinates by following the grid lines parallel to the correct zero-axis. Interpreting the position of a plotted point to determine the dominant component or classification. Identifying clusters or anomalies within a set of plotted points to draw conclusions about geographical patterns. A common slip: Following the grid lines in the wrong direction. Instead, tracing the line parallel to the axis that represents 0% for that specific variable. Exam tip: Use a ruler to trace the grid lines from each axis to ensure your point is plotted at the exact intersection of all three values.
See it
Label the diagram
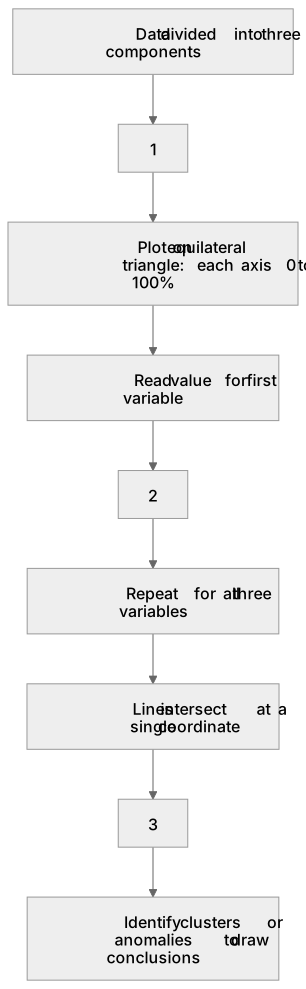
Some boxes have lost their names. Pick the right name for each number.
1Box 1
2Box 2
3Box 3
There is more to this lesson
The full lesson goes on to check your understanding and help you earn the marks. Create a free account to carry on, with your progress saved.
A week of Premium from your first lesson · Then the free plan continues · No card, no charge
Test your understanding of Graphical skills: Triangular graphs.
Active recall beats re-reading. Take an instant quiz now to test what you’ve learned and lock it into long-term memory.
A week of Premium from your first lesson · Then the free plan continues · No card, no charge