AQA · A-Level · Geography
Course version: 7037 · Version from Sept 2018
Graphical skills: Pie charts and proportional divided circles.
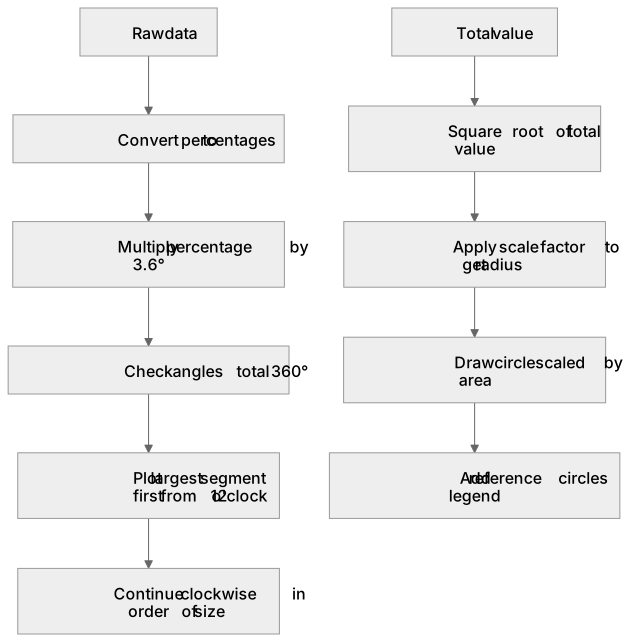
Pie charts display categorical data as slices of a circle, where each angle is proportional to the category's percentage of the total (found by multiplying the percentage by 3.6°).
Checked against the AQA 7037 specification (opens in a new tab) on .
- Point 4 of 7
- 2 key terms
Study notes
From the checked teaching notes for this specification point.
The idea
Pie charts display categorical data as slices of a circle, where each angle is proportional to the category's percentage of the total (found by multiplying the percentage by 3.6°). They show the composition of a whole, like a city's employment structure. Proportional divided circles extend this by scaling the circle's total area to represent the absolute total value, allowing spatial comparison across maps. The radius is calculated using the square root of the total value, ensuring the area (πr²) reflects the magnitude.
For example: Comparing total energy consumption between countries by circle size, while showing the percentage energy mix within each divided circle.
What earns the marks
- Accurately calculating angles for pie chart segments by converting raw data to percentages and multiplying by 3.6°.
- Determining the correct radius for proportional circles by extracting the square root of the total value and applying a suitable scale factor.
- Plotting segments accurately using a protractor, starting from the 12 o'clock position and working clockwise in order of size.
- Interpreting the relative size of proportional circles on a map to identify spatial patterns in absolute data totals.
Common mistakes and how to put them right
Scaling proportional circles by radius rather than area.
Put it right by using the square root of the data value to determine the radius.
Failing to include a key or scale for proportional circles.
Put it right by drawing reference circles representing specific values in the legend.
Plotting segments in a random order.
Put it right by plotting the largest segment first from the 12 o'clock position and proceeding clockwise.
Exam tips
- Always double-check that your calculated angles for a pie chart add up to exactly 360° before you begin drawing.
- When comparing proportional circles, look at the area rather than the diameter to estimate the difference in total values.
- Use a sharp pencil and a clear protractor to ensure your segment boundaries are plotted to an accuracy of within 1°.
Try the lesson
The start of the Graphical skills: Pie charts and proportional divided circles. lesson, made from checked teaching notes for this specification point.
Have a go first
A geographer is creating a pie chart to show the primary energy mix of a country. If coal represents 25% of the total energy consumption, what angle should be used to represent coal on the pie chart?
Listen
Pie charts display categorical data as slices of a circle, where each angle is proportional to the category's percentage of the total (found by multiplying the percentage by 3.6°). They show the composition of a whole, like a city's employment structure. Proportional divided circles extend this by scaling the circle's total area to represent the absolute total value, allowing spatial comparison across maps. The radius is calculated using the square root of the total value, ensuring the area (πr²) reflects the magnitude. For example, comparing total energy consumption between countries by circle size, while showing the percentage energy mix within each divided circle. A strong answer earns marks for these points. Accurately calculating angles for pie chart segments by converting raw data to percentages and multiplying by 3.6°. Determining the correct radius for proportional circles by extracting the square root of the total value and applying a suitable scale factor. Plotting segments accurately using a protractor, starting from the 12 o'clock position and working clockwise in order of size. Interpreting the relative size of proportional circles on a map to identify spatial patterns in absolute data totals. A common slip: Scaling proportional circles by radius rather than area. Instead, using the square root of the data value to determine the radius. Exam tip: Always double-check that your calculated angles for a pie chart add up to exactly 360° before you begin drawing.
See it
Key words
Say what each word means before you turn the card.
Pie charts
Try answering aloud or in your head before turning the card.
Proportional divided circles
Try answering aloud or in your head before turning the card.
See every definition
- Pie charts
- Display categorical data as slices of a circle, where each angle is proportional to the category's percentage of the total.
- Proportional divided circles
- Extend pie charts by scaling the circle's total area to represent the absolute total value, allowing spatial comparison across maps.
Label the diagram
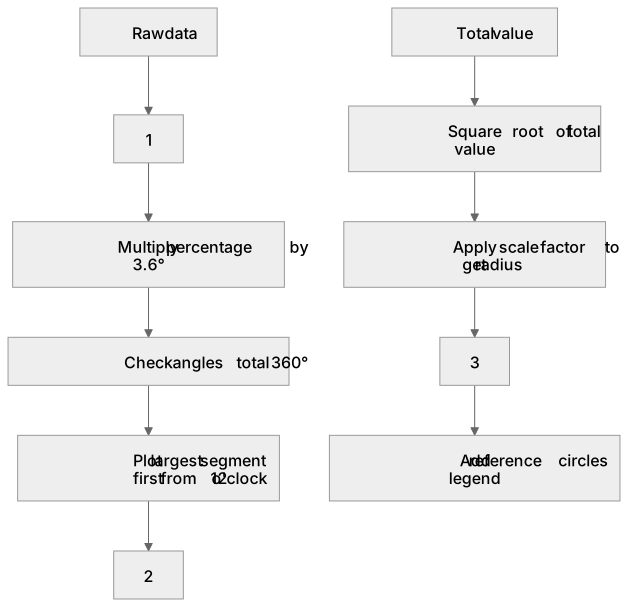
Some boxes have lost their names. Pick the right name for each number.
1Box 1
2Box 2
3Box 3
There is more to this lesson
The full lesson goes on to check your understanding and help you earn the marks. Create a free account to carry on, with your progress saved.
A week of Premium from your first lesson · Then the free plan continues · No card, no charge
Test your understanding of Graphical skills: Pie charts and proportional divided circles.
Active recall beats re-reading. Take an instant quiz now to test what you’ve learned and lock it into long-term memory.
A week of Premium from your first lesson · Then the free plan continues · No card, no charge