AQA · A-Level · Geography
Course version: 7037 · Version from Sept 2018
ICT skills: Use of electronic databases.
Electronic databases are structured collections of digital information that geographers use to access, filter, and analyse large volumes of secondary data.
Checked against the AQA 7037 specification (opens in a new tab) on .
- Point 2 of 4
- 2 key terms
Study notes
From the checked teaching notes for this specification point.
The idea
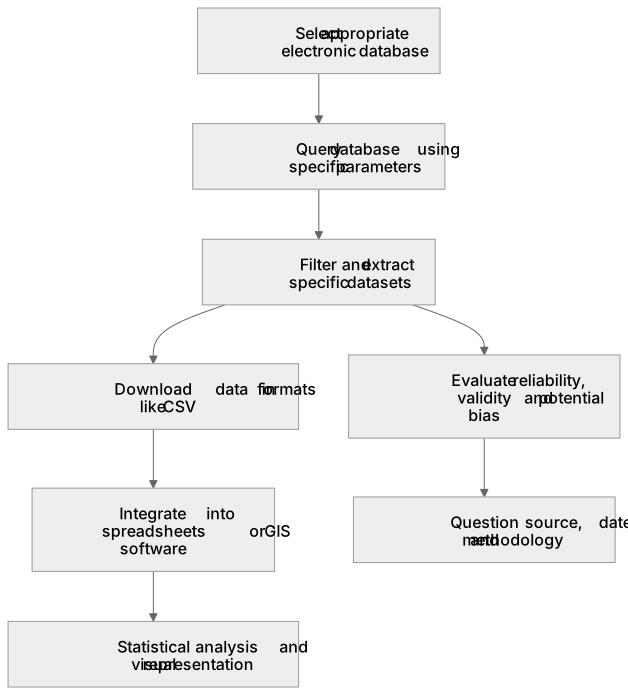
Electronic databases are structured collections of digital information that geographers use to access, filter, and analyse large volumes of secondary data. They are essential for investigating spatial and temporal trends across both physical and human geography. For example, using the Office for National Statistics (ONS) database allows students to extract demographic data for specific census output areas to evaluate urban inequality. Similarly, the Met Office database provides historical climate records to analyse long-term temperature anomalies. Effective use involves querying the database using specific parameters, downloading the data in formats like CSV, and integrating it into spreadsheets or GIS software for further statistical analysis and visual representation.
What earns the marks
- Identify appropriate electronic databases relevant to the specific geographical enquiry being undertaken.
- Demonstrate the ability to filter and extract specific datasets using targeted search parameters or queries.
- Evaluate the reliability, validity, and potential bias of the secondary data sourced from the chosen database.
- Process and present extracted database information using appropriate graphical, statistical, or GIS techniques.
Common mistakes and how to put them right
Accepting database information without questioning its provenance.
Put it right: Evaluate the source, date, and methodology of the data collection.
Downloading excessive, unfiltered data.
Put it right: Use specific search queries and filters within the database to extract only the variables relevant to the research question.
Assuming all electronic databases are entirely objective.
Put it right: Recognise that data categorisation and collection methods can introduce bias, even in official databases.
Exam tips
- Explicitly name the electronic databases you would use for a proposed enquiry, such as the Environment Agency for flood risk data.
- Explain exactly how you would filter the database, mentioning specific variables, timeframes, or spatial scales.
- Discuss the limitations of the database used, such as temporal gaps or changes in how variables are measured over time.
Try the lesson
The start of the ICT skills: Use of electronic databases. lesson, made from checked teaching notes for this specification point.
Have a go first
Which of the following best describes the primary advantage of using an electronic database for geographical research compared to paper records?
Listen
Electronic databases are structured collections of digital information that geographers use to access, filter, and analyse large volumes of secondary data. They are essential for investigating spatial and temporal trends across both physical and human geography. For example, using the Office for National Statistics (ONS) database allows students to extract demographic data for specific census output areas to evaluate urban inequality. Similarly, the Met Office database provides historical climate records to analyse long-term temperature anomalies. Effective use involves querying the database using specific parameters, downloading the data in formats like CSV, and integrating it into spreadsheets or GIS software for further statistical analysis and visual representation. A strong answer earns marks for these points. Identify appropriate electronic databases relevant to the specific geographical enquiry being undertaken. Demonstrate the ability to filter and extract specific datasets using targeted search parameters or queries. Evaluate the reliability, validity, and potential bias of the secondary data sourced from the chosen database. Process and present extracted database information using appropriate graphical, statistical, or GIS techniques. A common slip: Accepting database information without questioning its provenance. Instead, evaluate the source, date, and methodology of the data collection. Exam tip: Explicitly name the electronic databases you would use for a proposed enquiry, such as the Environment Agency for flood risk data.
See it
Key words
Say what each word means before you turn the card.
Data reliability
Try answering aloud or in your head before turning the card.
Geographical enquiry
Try answering aloud or in your head before turning the card.
See every definition
- Data reliability
- A quality to evaluate in secondary data sourced from a chosen database, alongside validity and potential bias.
- Geographical enquiry
- An investigation for which appropriate electronic databases are selected to source secondary data.
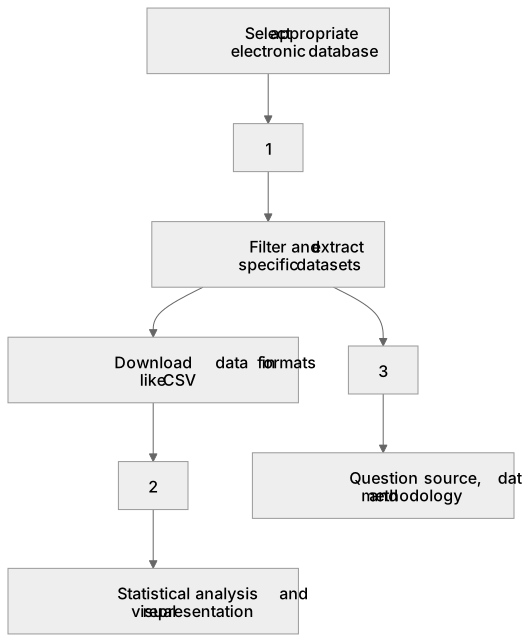
Label the diagram
Some boxes have lost their names. Pick the right name for each number.
1Box 1
2Box 2
3Box 3
There is more to this lesson
The full lesson goes on to check your understanding and help you earn the marks. Create a free account to carry on, with your progress saved.
A week of Premium from your first lesson · Then the free plan continues · No card, no charge
Test your understanding of ICT skills: Use of electronic databases.
Active recall beats re-reading. Take an instant quiz now to test what you’ve learned and lock it into long-term memory.
A week of Premium from your first lesson · Then the free plan continues · No card, no charge