Pearson Edexcel · A-Level · Mathematics
Course version: 9MA0 · Version from Mar 2026
Understand and use conditional probability, including the use of tree…
Full specification wording
Probability: 3.2 Understand and use conditional probability, including the use of tree diagrams, Venn diagrams, two-way tables. Understand and use the conditional probability formula P(A | B) = P(A ∩ B) / P(B).
Conditional probability is the probability of A given that B has occurred, written P(A | B).
Checked against the Pearson Edexcel 9MA0 specification (opens in a new tab) on .
- Point 2 of 3
- 4 key terms
Study notes
From the checked teaching notes for this specification point.
The idea
Conditional probability is the probability of A given that B has occurred, written P(A | B). The formula P(A | B) = P(A ∩ B) / P(B) requires P(B) > 0 and lets you reverse the conditioning using P(A ∩ B) = P(B) × P(A | B). Tree diagrams show sequential events, with branch probabilities multiplied along a path and added across paths; the second set of branches carries conditional probabilities. Venn diagrams display intersections and unions as regions, so P(A | B) is the proportion of the B region that also lies in A. Two-way tables organise counts by two categories, and conditional probability is a row or column proportion, not a proportion of the whole table.
For example: If 60 of 100 students study French, and 24 of those also study German, then P(German | French) = 24/60 = 0.4.
What earns the marks
- States and applies the formula P(A | B) = P(A ∩ B) / P(B), checking that P(B) > 0.
- Rearranges the formula to find P(A ∩ B) = P(B) × P(A | B) or P(B | A) = P(A ∩ B) / P(A).
- Constructs and interprets tree diagrams, multiplying along branches and adding across branches to obtain total probabilities.
- Uses Venn diagrams to identify P(A ∩ B), P(A ∪ B) and conditional probabilities from region areas or counts.
- Extracts conditional probabilities from two-way tables by dividing within the appropriate row or column total.
- Distinguishes P(A | B) from P(B | A) and from P(A ∩ B) in context.
Common mistakes and how to put them right
Confusing P(A | B) with P(B | A).
Put it right: Identify which event is given and to divide by P(B) when finding P(A | B).
Dividing by the grand total instead of the row or column total when using a two-way table.
Put it right: Use the total of the conditioning group.
Multiplying branch probabilities along a path but then forgetting to add the probabilities of all paths that satisfy the event.
Put it right: Sum across the relevant paths.
Exam tips
- Label every branch of a tree diagram with a conditional probability and check that branches from the same point sum to 1.
- In a two-way table, write the conditioning total underneath the fraction before calculating, to keep the denominator correct.
- Use the formula in symbols first, then substitute, so that a reversal of the conditioning is visible and avoidable.
Try the lesson
The start of the Probability: 3.2 Understand and use conditional probability, including the use of tree diagrams, Venn diagrams, two-way tables. Understand and use the conditional probability formula P(A | B) = P(A ∩ B) / P(B). lesson, made from checked teaching notes for this specification point.
Have a go first
For events A and B, P(A ∩ B) = 0.24 and P(B) = 0.6. What is P(A | B)?
Listen
Conditional probability is the probability of A given that B has occurred, written P(A | B). The formula P(A | B) = P(A ∩ B) / P(B) requires P(B) > 0 and lets you reverse the conditioning using P(A ∩ B) = P(B) × P(A | B). Tree diagrams show sequential events, with branch probabilities multiplied along a path and added across paths; the second set of branches carries conditional probabilities. Venn diagrams display intersections and unions as regions, so P(A | B) is the proportion of the B region that also lies in A. Two-way tables organise counts by two categories, and conditional probability is a row or column proportion, not a proportion of the whole table. For example, if 60 of 100 students study French, and 24 of those also study German, then P(German | French) = 24/60 = 0.4. A strong answer earns marks for these points. States and applies the formula P(A | B) = P(A ∩ B) / P(B), checking that P(B) > 0. Rearranges the formula to find P(A ∩ B) = P(B) × P(A | B) or P(B | A) = P(A ∩ B) / P(A). Constructs and interprets tree diagrams, multiplying along branches and adding across branches to obtain total probabilities. Uses Venn diagrams to identify P(A ∩ B), P(A ∪ B) and conditional probabilities from region areas or counts. A common slip: Confusing P(A | B) with P(B | A). Instead, identify which event is given and to divide by P(B) when finding P(A | B). Exam tip: Label every branch of a tree diagram with a conditional probability and check that branches from the same point sum to 1.
See it
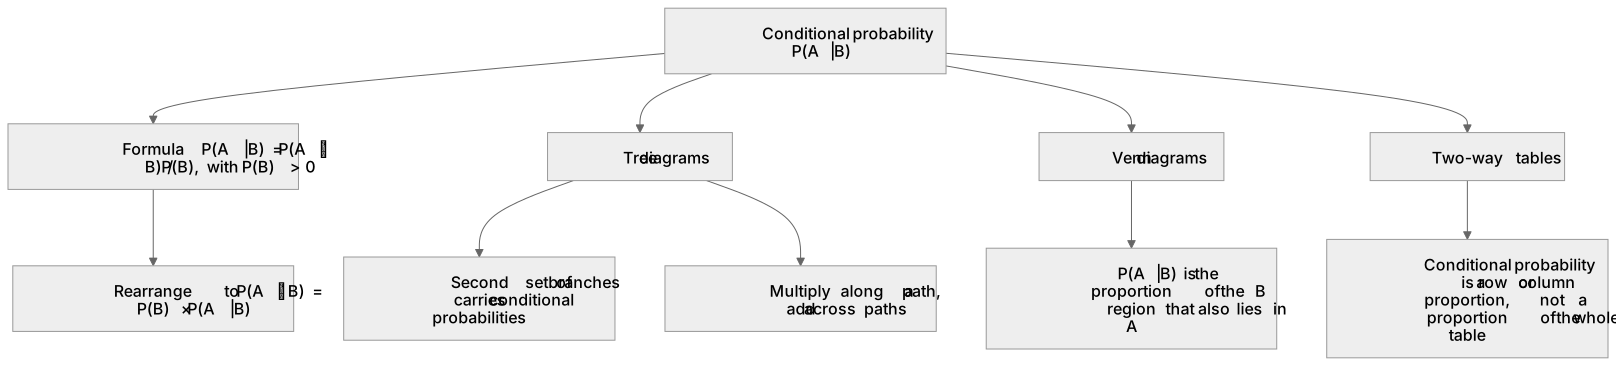
Key words
Say what each word means before you turn the card.
Conditional probability
Try answering aloud or in your head before turning the card.
Tree diagrams
Try answering aloud or in your head before turning the card.
Venn diagrams
Try answering aloud or in your head before turning the card.
Two-way tables
Try answering aloud or in your head before turning the card.
See every definition
- Conditional probability
- The probability of A given that B has occurred, written P(A | B).
- Tree diagrams
- Show sequential events, with branch probabilities multiplied along a path and added across paths, and the second set of branches carries conditional probabilities.
- Venn diagrams
- Display intersections and unions as regions, so P(A | B) is the proportion of the B region that also lies in A.
- Two-way tables
- Organise counts by two categories, and conditional probability is a row or column proportion, not a proportion of the whole table.
Label the diagram
Some boxes have lost their names. Pick the right name for each number.
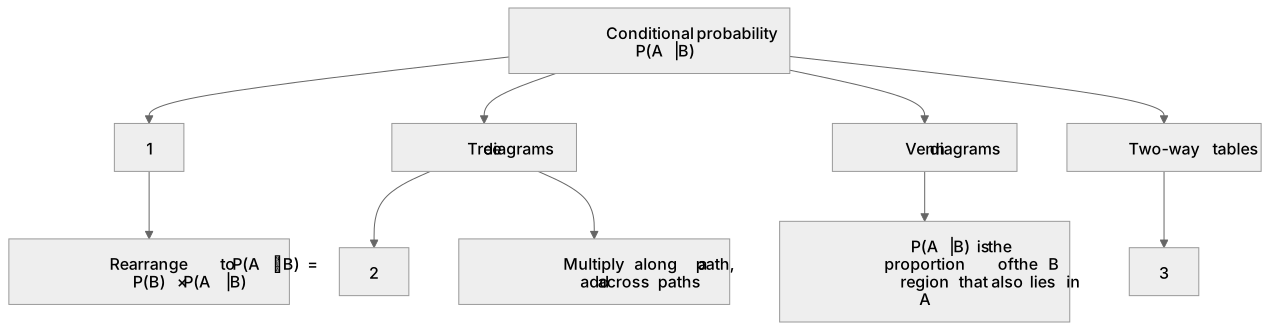
1Box 1
2Box 2
3Box 3
There is more to this lesson
The full lesson goes on to check your understanding and help you earn the marks. Create a free account to carry on, with your progress saved.
A week of Premium from your first lesson · Then the free plan continues · No card, no charge
Test your understanding of Probability: 3.2 Understand and use conditional probability, including the use of tree diagrams, Venn diagrams, two-way tables. Understand and use the conditional probability formula P(A | B) = P(A ∩ B) / P(B).
Active recall beats re-reading. Take an instant quiz now to test what you’ve learned and lock it into long-term memory.
A week of Premium from your first lesson · Then the free plan continues · No card, no charge