AQA · A-Level · Physical Education
Course version: 7582 · Version from Sept 2016
Cardiovascular system: Oxyhaemoglobin disassociation curve.
The oxyhaemoglobin dissociation curve is a graph plotting the percentage saturation of haemoglobin with oxygen against the partial pressure of oxygen (pO₂).
Checked against the AQA 7582 specification (opens in a new tab) on .
- Point 15 of 25
- 4 key terms
Study notes
From the checked teaching notes for this specification point.
The idea
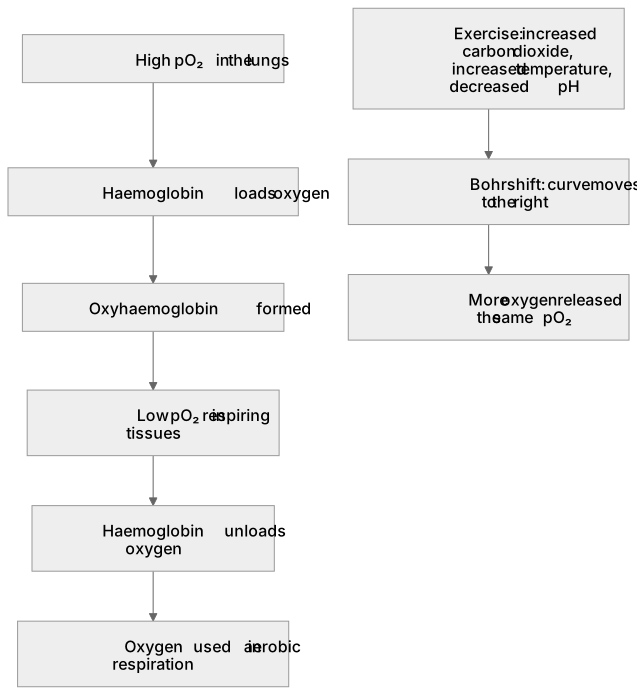
The oxyhaemoglobin dissociation curve is a graph plotting the percentage saturation of haemoglobin with oxygen against the partial pressure of oxygen (pO₂). At high pO₂ in the lungs, haemoglobin loads oxygen to form oxyhaemoglobin; at lower pO₂ in respiring tissues, it unloads oxygen. The curve is S-shaped (sigmoid) because binding the first oxygen molecule changes the shape of haemoglobin and makes binding the next molecules easier, a cooperative effect. The Bohr shift describes the curve moving to the right when carbon dioxide concentration rises, temperature increases or pH falls during exercise, meaning haemoglobin releases more oxygen at the same pO₂. Myoglobin's curve lies to the left, showing its higher affinity.
What earns the marks
- The curve plots percentage saturation of haemoglobin with oxygen on the y-axis against partial pressure of oxygen (pO₂) on the x-axis.
- The curve is sigmoid (S-shaped) because of cooperative binding: the first oxygen molecule bound alters haemoglobin's shape and increases its affinity for further oxygen molecules.
- At high pO₂ in the lungs, haemoglobin has a high affinity for oxygen and becomes almost fully saturated, forming oxyhaemoglobin.
- At low pO₂ in respiring tissues, haemoglobin's affinity for oxygen decreases and oxygen dissociates to be used in aerobic respiration.
- The Bohr shift moves the curve to the right when carbon dioxide concentration increases, pH decreases or temperature rises during exercise, so more oxygen is released at the same pO₂.
- Myoglobin's dissociation curve lies to the left of haemoglobin's, reflecting its higher affinity for oxygen.
Common mistakes and how to put them right
Reversing the axes: percentage saturation of haemoglobin with oxygen is on the y-axis and partial pressure of oxygen is on the x-axis.
Describing the curve as a straight line.
Put it right: It is sigmoid because cooperative binding makes the middle section steeper.
Confusing a rightward shift with reduced oxygen release.
Put it right: A rightward (Bohr) shift means haemoglobin releases more oxygen to tissues at the same pO₂.
Thinking the Bohr shift occurs because haemoglobin has a lower affinity at high pO₂.
Put it right: The shift is caused by increased carbon dioxide, increased temperature and decreased pH in active muscle.
Exam tips
- Use the terms 'loads' at the lungs and 'unloads' or 'dissociates' at the tissues to describe the two ends of the curve.
- Link the Bohr shift to exercise by naming the specific changes: increased carbon dioxide, increased temperature and decreased pH.
- Compare the myoglobin curve with the haemoglobin curve by stating that myoglobin sits to the left because of its higher oxygen affinity.
Try the lesson
The start of the Cardiovascular system: Oxyhaemoglobin disassociation curve. lesson, made from checked teaching notes for this specification point.
Have a go first
On an oxyhaemoglobin disassociation curve, what does the vertical axis represent?
Listen
The oxyhaemoglobin dissociation curve is a graph plotting the percentage saturation of haemoglobin with oxygen against the partial pressure of oxygen (pO₂). At high pO₂ in the lungs, haemoglobin loads oxygen to form oxyhaemoglobin; at lower pO₂ in respiring tissues, it unloads oxygen. The curve is S-shaped (sigmoid) because binding the first oxygen molecule changes the shape of haemoglobin and makes binding the next molecules easier, a cooperative effect. The Bohr shift describes the curve moving to the right when carbon dioxide concentration rises, temperature increases or pH falls during exercise, meaning haemoglobin releases more oxygen at the same pO₂. Myoglobin's curve lies to the left, showing its higher affinity. A strong answer earns marks for these points. The curve plots percentage saturation of haemoglobin with oxygen on the y-axis against partial pressure of oxygen (pO₂) on the x-axis. The curve is sigmoid (S-shaped) because of cooperative binding: the first oxygen molecule bound alters haemoglobin's shape and increases its affinity for further oxygen molecules. At high pO₂ in the lungs, haemoglobin has a high affinity for oxygen and becomes almost fully saturated, forming oxyhaemoglobin. At low pO₂ in respiring tissues, haemoglobin's affinity for oxygen decreases and oxygen dissociates to be used in aerobic respiration. Exam tip: Use the terms 'loads' at the lungs and 'unloads' or 'dissociates' at the tissues to describe the two ends of the curve.
See it
Key words
Say what each word means before you turn the card.
Oxygen transport by haemoglobin
Try answering aloud or in your head before turning the card.
Cooperative binding and the sigmoid curve
Try answering aloud or in your head before turning the card.
Bohr shift during exercise
Try answering aloud or in your head before turning the card.
Comparison of haemoglobin and myoglobin affinity
Try answering aloud or in your head before turning the card.
See every definition
- Oxygen transport by haemoglobin
- At high pO₂ in the lungs, haemoglobin loads oxygen to form oxyhaemoglobin; at lower pO₂ in respiring tissues, it unloads oxygen.
- Cooperative binding and the sigmoid curve
- The curve is S-shaped because binding the first oxygen molecule changes the shape of haemoglobin and makes binding the next molecules easier.
- Bohr shift during exercise
- The curve moves to the right when carbon dioxide concentration rises, temperature increases or pH falls during exercise, meaning haemoglobin releases more oxygen at the same pO₂.
- Comparison of haemoglobin and myoglobin affinity
- Myoglobin's curve lies to the left, showing its higher affinity.
Label the diagram
Some boxes have lost their names. Pick the right name for each number.
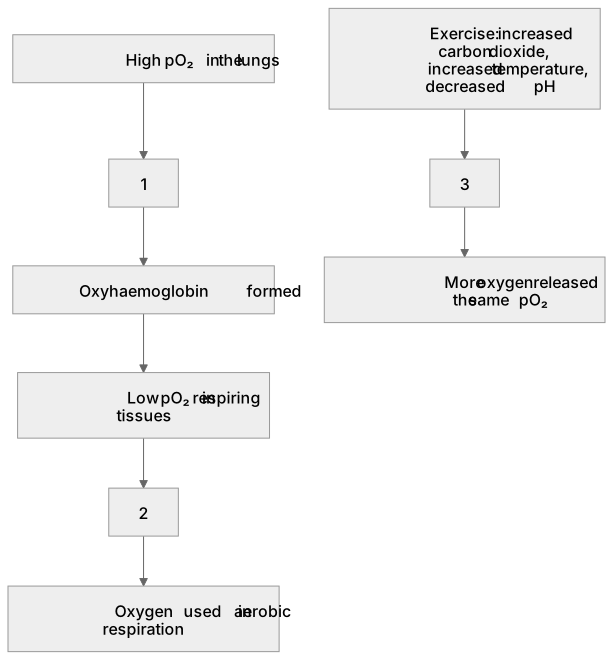
1Box 1
2Box 2
3Box 3
There is more to this lesson
The full lesson goes on to check your understanding and help you earn the marks. Create a free account to carry on, with your progress saved.
A week of Premium from your first lesson · Then the free plan continues · No card, no charge
Test your understanding of Cardiovascular system: Oxyhaemoglobin disassociation curve.
Active recall beats re-reading. Take an instant quiz now to test what you’ve learned and lock it into long-term memory.
A week of Premium from your first lesson · Then the free plan continues · No card, no charge