AQA · A-Level · Physical Education
Course version: 7582 · Version from Sept 2016
Quantitative and qualitative.
Full specification wording
Preparation and training methods in relation to maintaining physical activity and performance: Quantitative and qualitative.
Quantitative data are numerical and can be measured or counted, such as a VO₂ max of 55 ml·kg⁻¹·min⁻¹, a 30 m sprint time of 4.2 s, or a Rating of Perceived Exertion (RPE) score.
Checked against the AQA 7582 specification (opens in a new tab) on .
- Point 2 of 19
- 2 key terms
Study notes
From the checked teaching notes for this specification point.
The idea
Quantitative data are numerical and can be measured or counted, such as a VO₂ max of 55 ml·kg⁻¹·min⁻¹, a 30 m sprint time of 4.2 s, or a Rating of Perceived Exertion (RPE) score. Qualitative data are descriptive and non-numerical, such as a coach's observation of a performer's technique, or an athlete's written feedback on their motivation levels. In preparation and training, quantitative data support objective monitoring of progress and comparison against norms, while qualitative data provide context about feelings and adherence. Both types are useful: a training programme might use quantitative load measures alongside qualitative feedback on fatigue. When interpreting data, consider validity and reliability.
What earns the marks
- Quantitative data consist of numerical information that can be measured or counted, such as time, distance, heart rate, or RPE scores.
- Qualitative data consist of descriptive, non-numerical information, such as observations of technique or interview responses about motivation.
- Quantitative data allow for objective comparison, tracking of progress, and statistical analysis, often produced by standardised tests.
- Qualitative data provide subjective insight into factors such as confidence, technique and well-being that numbers alone may not fully capture.
Common mistakes and how to put them right
Classifying Rating of Perceived Exertion (RPE) as qualitative data.
Put it right: RPE uses a numerical scale (e.g., Borg scale) and therefore yields quantitative data, despite being subjective.
Thinking qualitative data are always useless because they are subjective.
Put it right: Qualitative data can systematically reveal important information about technique and well-being.
Assuming quantitative data are always perfectly objective.
Put it right: Quantitative data can be inaccurate if the measurement tool is poorly calibrated or the protocol is flawed.
Exam tips
- In multiple-choice questions, look for the option that correctly defines quantitative as numerical and qualitative as descriptive.
- Remember that subjective scales producing numbers, like RPE or questionnaires with numerical ratings, generate quantitative data.
- When evaluating monitoring methods, discuss how combining quantitative metrics with qualitative feedback provides the most effective evaluation.
Try the lesson
The start of the Preparation and training methods in relation to maintaining physical activity and performance: Quantitative and qualitative. lesson, made from checked teaching notes for this specification point.
Have a go first
During a fitness test, a coach records a performer's heart rate as 162 beats per minute and their rating of perceived exertion as 15 on the Borg scale. Which term best describes the heart rate value of 162 beats per minute?
Listen
Quantitative data are numerical and can be measured or counted, such as a VO₂ max of 55 ml·kg⁻¹·min⁻¹, a 30 m sprint time of 4.2 s, or a Rating of Perceived Exertion (RPE) score. Qualitative data are descriptive and non-numerical, such as a coach's observation of a performer's technique, or an athlete's written feedback on their motivation levels. In preparation and training, quantitative data support objective monitoring of progress and comparison against norms, while qualitative data provide context about feelings and adherence. Both types are useful: a training programme might use quantitative load measures alongside qualitative feedback on fatigue. When interpreting data, consider validity and reliability. A strong answer earns marks for these points. Quantitative data consist of numerical information that can be measured or counted, such as time, distance, heart rate, or RPE scores. Qualitative data consist of descriptive, non-numerical information, such as observations of technique or interview responses about motivation. Quantitative data allow for objective comparison, tracking of progress, and statistical analysis, often produced by standardised tests. Qualitative data provide subjective insight into factors such as confidence, technique and well-being that numbers alone may not fully capture. Exam tip: In multiple-choice questions, look for the option that correctly defines quantitative as numerical and qualitative as descriptive.
See it
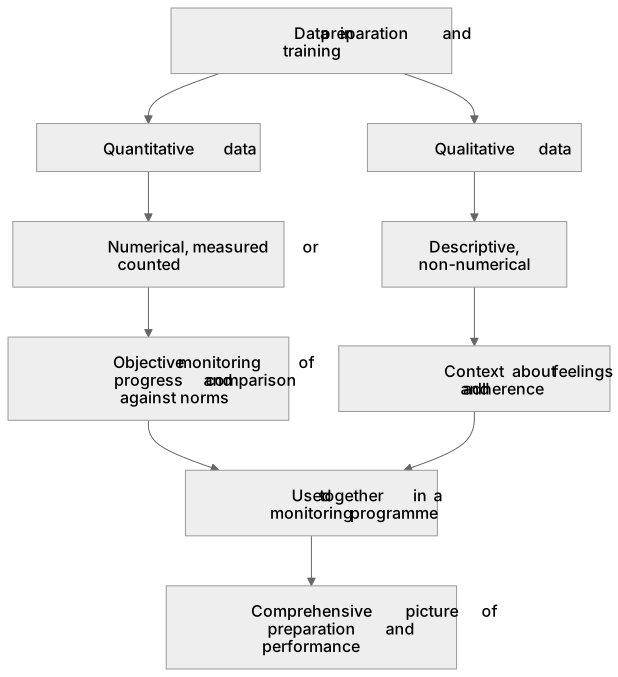
Key words
Say what each word means before you turn the card.
Quantitative data
Try answering aloud or in your head before turning the card.
Qualitative data
Try answering aloud or in your head before turning the card.
See every definition
- Quantitative data
- Numerical information that can be measured or counted, such as a VO₂ max of 55 ml·kg⁻¹·min⁻¹, a 30 m sprint time of 4.2 s, or a Rating of Perceived Exertion (RPE) score.
- Qualitative data
- Descriptive and non-numerical information, such as a coach's observation of a performer's technique, or an athlete's written feedback on their motivation levels.
Label the diagram
Some boxes have lost their names. Pick the right name for each number.
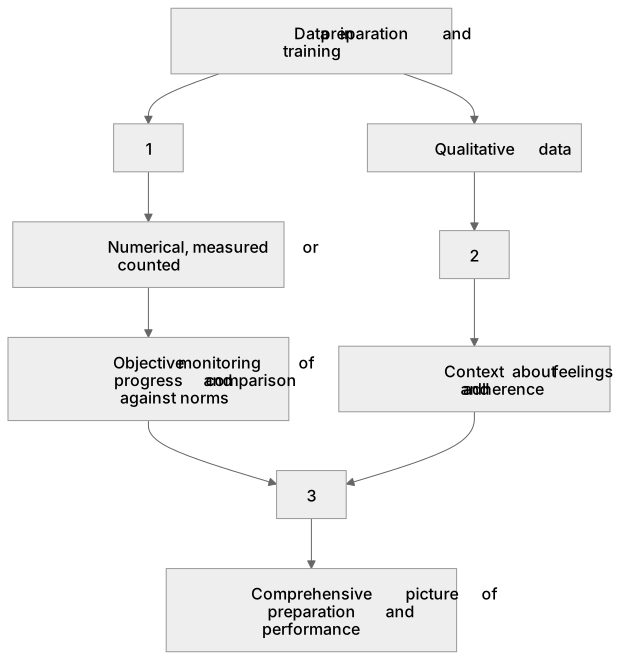
1Box 1
2Box 2
3Box 3
There is more to this lesson
The full lesson goes on to check your understanding and help you earn the marks. Create a free account to carry on, with your progress saved.
A week of Premium from your first lesson · Then the free plan continues · No card, no charge
Test your understanding of Preparation and training methods in relation to maintaining physical activity and performance: Quantitative and qualitative.
Active recall beats re-reading. Take an instant quiz now to test what you’ve learned and lock it into long-term memory.
A week of Premium from your first lesson · Then the free plan continues · No card, no charge