OCR · A-Level · Physics
Course version: H556 · Version from Sept 2015
Damping: (d) amplitude-driving frequency graphs for forced oscillators
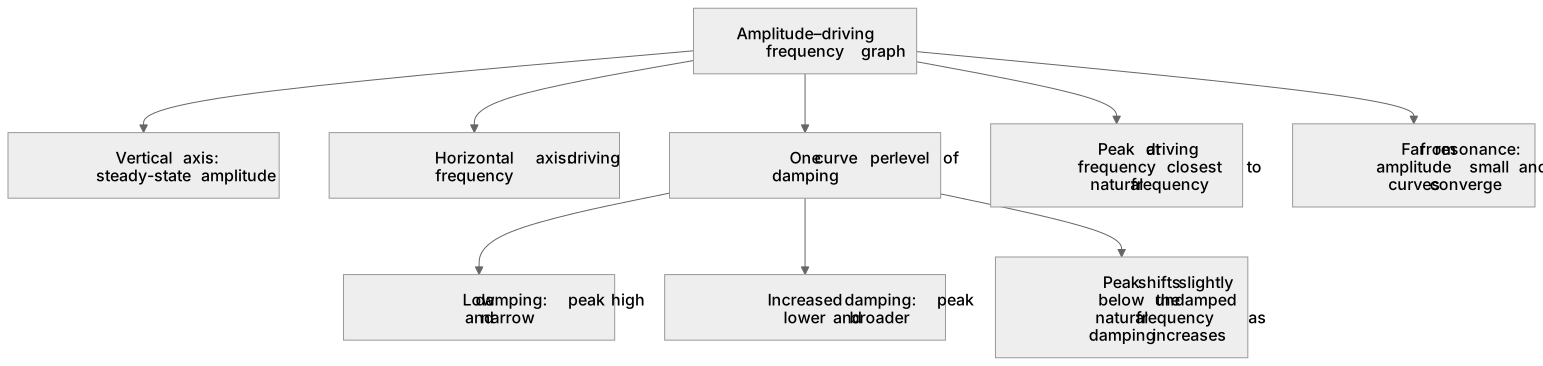
An amplitude–driving frequency graph plots the steady-state amplitude of a forced oscillator against the driving frequency, with one curve for each level of damping.
Checked against the OCR H556 specification (opens in a new tab) on .
- Point 4 of 5
- 4 key terms
Study notes
From the checked teaching notes for this specification point.
The idea
An amplitude–driving frequency graph plots the steady-state amplitude of a forced oscillator against the driving frequency, with one curve for each level of damping. At low damping the curve peaks sharply near the natural frequency, so the resonant amplitude is large; as damping increases the peak becomes lower and broader and shifts slightly below the natural frequency. Far from resonance the amplitude is small and all curves converge. To read such a graph, identify the natural frequency from the peak position, compare peak heights to judge relative damping, and note that a broader curve means the oscillator responds appreciably over a wider frequency range.
What earns the marks
- Steady-state amplitude is plotted on the vertical axis and driving frequency on the horizontal axis.
- The peak occurs at the driving frequency closest to the natural frequency of the oscillator.
- Reducing damping raises and narrows the resonant peak; increasing damping lowers and broadens it.
- At driving frequencies well away from resonance the amplitude is small and curves for different damping converge.
- The resonant peak shifts slightly to a driving frequency below the undamped natural frequency as damping increases.
Common mistakes and how to put them right
Confusing the natural frequency with the driving frequency at which amplitude is largest.
Put it right: The peak is at the driving frequency nearest the natural frequency, not at an arbitrary point.
Thinking that heavier damping increases the resonant amplitude.
Put it right: Heavier damping always reduces the peak amplitude and broadens the curve.
Assuming all curves peak at exactly the same driving frequency.
Put it right: Increased damping shifts the peak slightly below the undamped natural frequency.
Reading the vertical axis as acceleration or energy rather than steady-state amplitude.
Exam tips
- State the axes and units before interpreting any feature of the graph.
- Compare peak heights to rank damping levels, then compare widths to confirm the ranking.
- When asked to explain a curve, link low damping to a large resonant amplitude and a narrow frequency band.
- Check whether the question asks about amplitude, energy or phase before choosing an answer.
Try the lesson
The start of the Damping: (d) amplitude-driving frequency graphs for forced oscillators lesson, made from checked teaching notes for this specification point.
Listen
An amplitude–driving frequency graph plots the steady-state amplitude of a forced oscillator against the driving frequency, with one curve for each level of damping. At low damping the curve peaks sharply near the natural frequency, so the resonant amplitude is large; as damping increases the peak becomes lower and broader and shifts slightly below the natural frequency. Far from resonance the amplitude is small and all curves converge. To read such a graph, identify the natural frequency from the peak position, compare peak heights to judge relative damping, and note that a broader curve means the oscillator responds appreciably over a wider frequency range. A strong answer earns marks for these points. Steady-state amplitude is plotted on the vertical axis and driving frequency on the horizontal axis. The peak occurs at the driving frequency closest to the natural frequency of the oscillator. Reducing damping raises and narrows the resonant peak; increasing damping lowers and broadens it. At driving frequencies well away from resonance the amplitude is small and curves for different damping converge. Exam tip: State the axes and units before interpreting any feature of the graph.
See it
Key words
Say what each word means before you turn the card.
Amplitude–driving frequency graph
Try answering aloud or in your head before turning the card.
Resonant peak
Try answering aloud or in your head before turning the card.
Damping and resonance amplitude
Try answering aloud or in your head before turning the card.
Natural frequency versus driving frequency
Try answering aloud or in your head before turning the card.
See every definition
- Amplitude–driving frequency graph
- A plot of the steady-state amplitude of a forced oscillator against the driving frequency, with one curve for each level of damping.
- Resonant peak
- The peak of the curve, occurring at the driving frequency closest to the natural frequency of the oscillator, where the resonant amplitude is large at low damping.
- Damping and resonance amplitude
- Reducing damping raises and narrows the resonant peak, while increasing damping lowers and broadens it and shifts the peak slightly below the natural frequency.
- Natural frequency versus driving frequency
- The peak is at the driving frequency nearest the natural frequency, not at an arbitrary point, and increased damping shifts the peak slightly below the undamped natural frequency.
Label the diagram
Some boxes have lost their names. Pick the right name for each number.
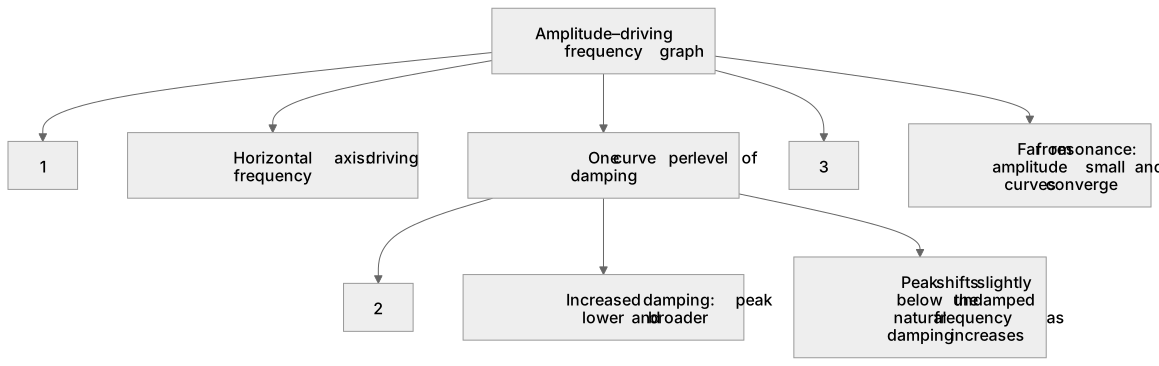
1Box 1
2Box 2
3Box 3
There is more to this lesson
The full lesson goes on to check your understanding and help you earn the marks. Create a free account to carry on, with your progress saved.
A week of Premium from your first lesson · Then the free plan continues · No card, no charge
Test your understanding of Damping: (d) amplitude-driving frequency graphs for forced oscillators
Active recall beats re-reading. Take an instant quiz now to test what you’ve learned and lock it into long-term memory.
A week of Premium from your first lesson · Then the free plan continues · No card, no charge