AQA · A-Level · Psychology
Course version: 7182-2025 · Exams from 2027
Construct and interpret frequency tables and diagrams, bar charts and…
Full specification wording
Handling data: Construct and interpret frequency tables and diagrams, bar charts and histograms (to include: selecting and sketching an appropriate form of data display for a given set of data)
The display has to match the data.
Checked against the AQA 7182-2025 specification (opens in a new tab) on .
- Point 3 of 17
- 3 key terms
Study notes
From the checked teaching notes for this specification point.
The idea
The display has to match the data. Counts of people in named categories, or the mean score of each condition, go in a bar chart, whose bars are drawn with gaps between them because the categories do not run into one another and could be reordered without changing the meaning. Continuous data grouped into equal class intervals, such as reaction times sorted into bands, go in a histogram, whose bars touch because the underlying scale is unbroken and the intervals follow a fixed order. Before either comes the tally: sort the raw scores into categories or intervals, total each row, and check the grand total against the number of participants to construct a frequency table. Every display needs a title, both axes labelled with what they show and their units, and a frequency scale beginning at zero, because a truncated scale makes a small difference look dramatic.
What earns the marks
- Bar chart conventions: discrete or nominal categories along the horizontal axis, frequency or mean score up the vertical axis, bars of equal width with clear gaps between them.
- Histogram conventions: continuous data along the horizontal axis in equal intervals in their natural order, frequency up the vertical axis, bars touching with no gaps, and intervals that do not overlap.
- Frequency table conventions: a column of categories or class intervals, a tally column and a frequency column, with the frequencies summing to the number of scores collected.
- Interpretation requires stating the shape of the distribution, identifying which category or interval holds the highest frequency, and relating that to the hypothesis rather than just reading the numbers aloud.
Common mistakes and how to put them right
Drawing a histogram with gaps or a bar chart with the bars touching, which tells the examiner the data are continuous when they are categories, or the reverse.
Leaving the axes unlabelled or omitting the unit, so the sketch cannot be read at all.
Put it right: Labels are essential for clarity.
Using a scattergram for the two conditions of an experiment, when a scattergram shows a relationship between two co-variables measured on the same people and not a difference between groups.
Starting the frequency axis part way up the scale so that two nearly equal bars look very different.
Exam tips
- A sketching question requires selecting the right type of display, labelling axes with units, and accurate plotting, so ensure all three are completed even when time is short.
- Where a finished graph is printed and you are asked what it shows, give the pattern and the comparison in the terms of the study, not a description of the drawing.
- If asked to choose an appropriate display, name it and justify it by naming the level of measurement, for example that data counted into named categories are nominal and so go in a bar chart.
Try the lesson
The start of the Handling data: Construct and interpret frequency tables and diagrams, bar charts and histograms (to include: selecting and sketching an appropriate form of data display for a given set of data) lesson, made from checked teaching notes for this specification point.
Have a go first
A researcher records the number of participants who select one of four different brands of chocolate. Which type of graph is most appropriate to display this categorical data?
Listen
The display has to match the data. Counts of people in named categories, or the mean score of each condition, go in a bar chart, whose bars are drawn with gaps between them because the categories do not run into one another and could be reordered without changing the meaning. Continuous data grouped into equal class intervals, such as reaction times sorted into bands, go in a histogram, whose bars touch because the underlying scale is unbroken and the intervals follow a fixed order. Before either comes the tally: sort the raw scores into categories or intervals, total each row, and check the grand total against the number of participants to construct a frequency table. Every display needs a title, both axes labelled with what they show and their units, and a frequency scale beginning at zero, because a truncated scale makes a small difference look dramatic. A strong answer earns marks for these points. Bar chart conventions: discrete or nominal categories along the horizontal axis, frequency or mean score up the vertical axis, bars of equal width with clear gaps between them. Histogram conventions: continuous data along the horizontal axis in equal intervals in their natural order, frequency up the vertical axis, bars touching with no gaps, and intervals that do not overlap. Frequency table conventions: a column of categories or class intervals, a tally column and a frequency column, with the frequencies summing to the number of scores collected. Interpretation requires stating the shape of the distribution, identifying which category or interval holds the highest frequency, and relating that to the hypothesis rather than just reading the numbers aloud. Exam tip: A sketching question requires selecting the right type of display, labelling axes with units, and accurate plotting, so ensure all three are completed even when time is short.
See it
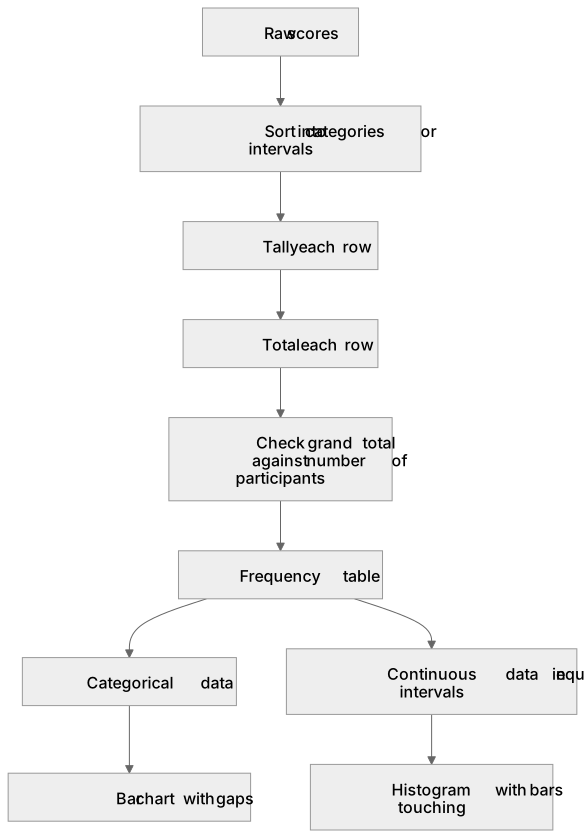
Key words
Say what each word means before you turn the card.
bar chart
Try answering aloud or in your head before turning the card.
histogram
Try answering aloud or in your head before turning the card.
frequency table
Try answering aloud or in your head before turning the card.
See every definition
- bar chart
- A display for counts of people in named categories or the mean score of each condition, with bars of equal width and clear gaps between them.
- histogram
- A display for continuous data grouped into equal class intervals, with bars that touch because the underlying scale is unbroken and the intervals follow a fixed order.
- frequency table
- A table built by sorting raw scores into categories or intervals, totalling each row, and checking the grand total against the number of participants.
Label the diagram
Some boxes have lost their names. Pick the right name for each number.
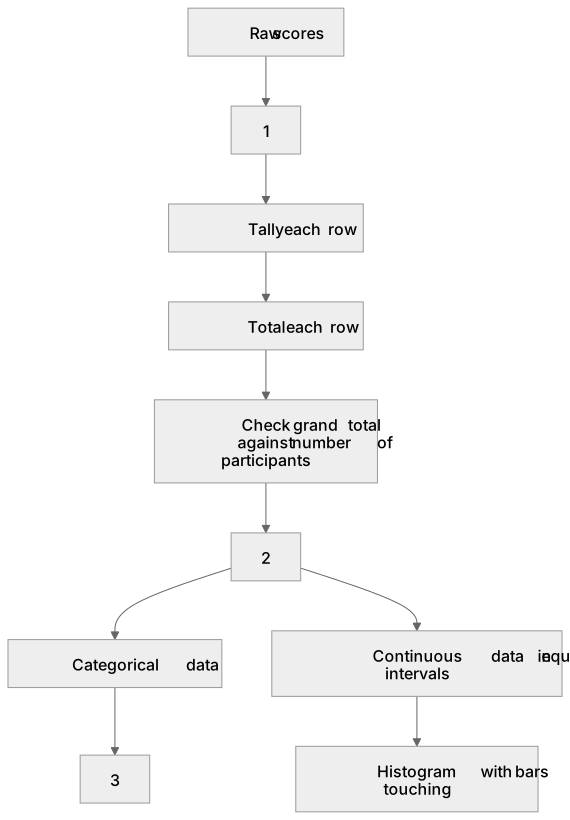
1Box 1
2Box 2
3Box 3
There is more to this lesson
The full lesson goes on to check your understanding and help you earn the marks. Create a free account to carry on, with your progress saved.
A week of Premium from your first lesson · Then the free plan continues · No card, no charge
Test your understanding of Handling data: Construct and interpret frequency tables and diagrams, bar charts and histograms (to include: selecting and sketching an appropriate form of data display for a given set of data)
Active recall beats re-reading. Take an instant quiz now to test what you’ve learned and lock it into long-term memory.
A week of Premium from your first lesson · Then the free plan continues · No card, no charge