AQA · A-Level · Psychology
Course version: 7182-2025 · Exams from 2027
Find arithmetic means (to include: calculating the means for two…
Full specification wording
Handling data: Find arithmetic means (to include: calculating the means for two conditions using raw data from a class experiment)
The mean is the total of the scores divided by how many scores there are.
Checked against the AQA 7182-2025 specification (opens in a new tab) on .
- Point 2 of 17
- 4 key terms
Study notes
From the checked teaching notes for this specification point.
The idea
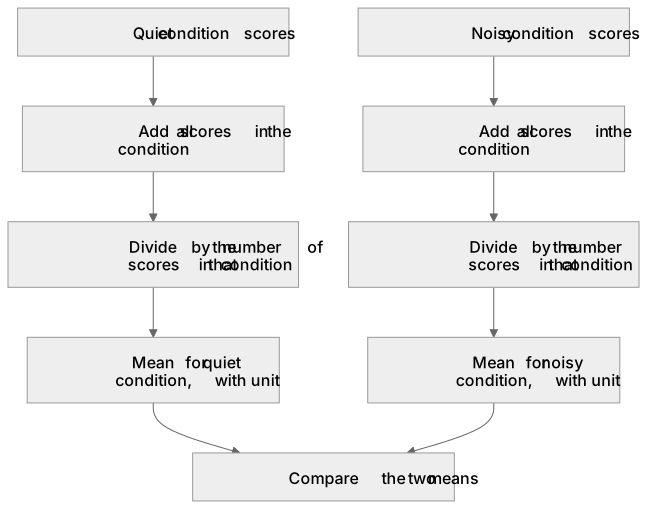
The mean is the total of the scores divided by how many scores there are. In an experiment, it is calculated separately for each condition to allow comparison. With eight participants recalling 7, 9, 12, 6, 10, 8, 11 and 9 words in the quiet condition, the total is 72 and the mean is 9.0 words. With 5, 4, 8, 6, 7, 5, 9 and 8 words in the noisy condition, the total is 52 and the mean is 6.5 words, a gap of 2.5 words in favour of quiet. Divide by the number of scores in that condition, never by the total number of people in the study, and keep the unit on the answer. Because every score is used, the mean is the most sensitive measure of central tendency, which is why one extreme score can drag it away from the bulk of the data.
What earns the marks
- The method written as a method: add all the scores in one condition, then divide by the number of scores in that condition. Write the sum out rather than only the final figure to show the working clearly.
- Two conditions, two calculations: the answer sentence compares them, for example the mean number of words recalled was 9.0 in the quiet condition and 6.5 in the noisy condition, a difference of 2.5 words.
- Units and precision: quote the result in the unit of the original measure and to an appropriate number of decimal places, typically one more than the raw data, so 6.5 words is acceptable and 6.500 words is not.
Common mistakes and how to put them right
Adding the totals of both conditions and dividing by all the participants, which produces one overall figure and answers a question nobody asked.
Letting the divisor drift away from the data, by including a participant who withdrew or by treating a score of zero as no score at all and dividing by a smaller number.
Leaving the unit off, so a figure such as 6.5 sits on the page with nothing to say whether it counts words, seconds or errors.
Reporting the answer to five decimal places because that is what the calculator displayed.
Exam tips
- The data always arrive in a printed table, so put the total on the page first to demonstrate the initial step of the calculation.
- A calculation is frequently followed by an instruction to say what the two figures show, which asks for the size and direction of the difference and not for a claim about statistical significance.
- Check whether the question wants the result for each condition or for each participant group, because the two are not the same when group sizes are unequal.
Try the lesson
The start of the Handling data: Find arithmetic means (to include: calculating the means for two conditions using raw data from a class experiment) lesson, made from checked teaching notes for this specification point.
Have a go first
A psychologist records the number of words recalled by five participants in a memory test. The scores are 11, 12, 18, 14, and 20. What is the arithmetic mean of these scores?
Listen
The mean is the total of the scores divided by how many scores there are. In an experiment, it is calculated separately for each condition to allow comparison. With eight participants recalling 7, 9, 12, 6, 10, 8, 11 and 9 words in the quiet condition, the total is 72 and the mean is 9.0 words. With 5, 4, 8, 6, 7, 5, 9 and 8 words in the noisy condition, the total is 52 and the mean is 6.5 words, a gap of 2.5 words in favour of quiet. Divide by the number of scores in that condition, never by the total number of people in the study, and keep the unit on the answer. Because every score is used, the mean is the most sensitive measure of central tendency, which is why one extreme score can drag it away from the bulk of the data. A strong answer earns marks for these points. The method written as a method: add all the scores in one condition, then divide by the number of scores in that condition. Write the sum out rather than only the final figure to show the working clearly. Two conditions, two calculations: the answer sentence compares them, for example the mean number of words recalled was 9.0 in the quiet condition and 6.5 in the noisy condition, a difference of 2.5 words. Units and precision: quote the result in the unit of the original measure and to an appropriate number of decimal places, typically one more than the raw data, so 6.5 words is acceptable and 6.500 words is not. Justifying the choice of measure: this average is suitable for interval data with no extreme scores because it takes account of every value, and that reason is what is required when the calculation is followed by an explanation. Exam tip: The data always arrive in a printed table, so put the total on the page first to demonstrate the initial step of the calculation.
See it
Key words
Say what each word means before you turn the card.
measures of central tendency
Try answering aloud or in your head before turning the card.
raw data handling
Try answering aloud or in your head before turning the card.
condition by condition comparison
Try answering aloud or in your head before turning the card.
sensitivity to anomalies
Try answering aloud or in your head before turning the card.
See every definition
- measures of central tendency
- The mean is the most sensitive measure of central tendency because every score is used.
- raw data handling
- Add all the scores in one condition, then divide by the number of scores in that condition, writing the sum out to show the working.
- condition by condition comparison
- The mean is calculated separately for each condition to allow comparison, stating both means with their unit and the difference between them.
- sensitivity to anomalies
- Because every score is used, one extreme score can drag the mean away from the bulk of the data.
There is more to this lesson
The full lesson goes on to check your understanding and help you earn the marks. Create a free account to carry on, with your progress saved.
A week of Premium from your first lesson · Then the free plan continues · No card, no charge
Test your understanding of Handling data: Find arithmetic means (to include: calculating the means for two conditions using raw data from a class experiment)
Active recall beats re-reading. Take an instant quiz now to test what you’ve learned and lock it into long-term memory.
A week of Premium from your first lesson · Then the free plan continues · No card, no charge