AQA · A-Level · Psychology
Course version: 7182-2025 · Exams from 2027
Understand the differences between qualitative and quantitative data (to…
Full specification wording
Handling data: Understand the differences between qualitative and quantitative data (to include: explaining how a given qualitative measure (for example, an interview transcript) might be converted into quantitative data)
Numbers that record how much or how many, such as reaction times, scores on a memory test or tallies of aggressive acts, are quantitative.
Checked against the AQA 7182-2025 specification (opens in a new tab) on .
- Point 16 of 17
- 4 key terms
Study notes
From the checked teaching notes for this specification point.
The idea
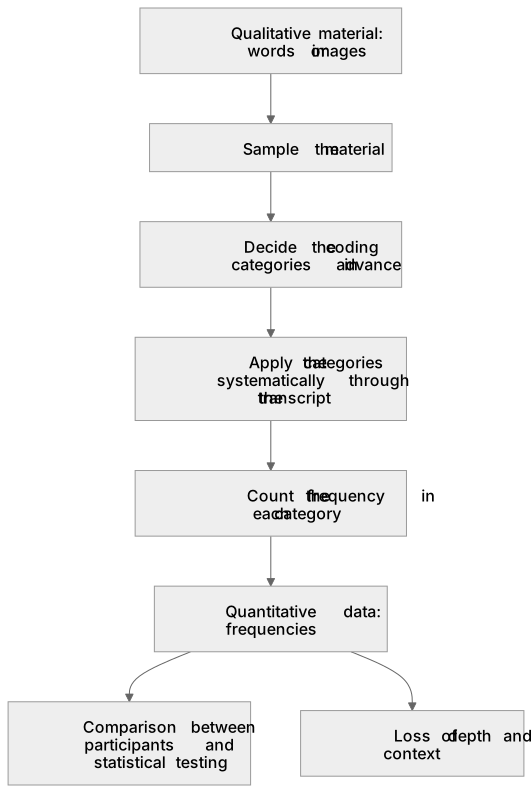
Numbers that record how much or how many, such as reaction times, scores on a memory test or tallies of aggressive acts, are quantitative. Material expressed in words or images that carries meaning, such as what a participant said in an interview, an answer to an open question or a diary entry, is qualitative. The exam usually asks for the bridge between the two, and that bridge is content analysis. The researcher reads the material, agrees coding categories in advance, works through applying them, and counts how often each category appears, turning words into frequencies that can be graphed and tested with Chi Square. What is gained is comparison and statistical analysis; what is lost is the depth and the context of what was actually said.
What earns the marks
- Defining each type by what it is rather than by how it was gathered, so quantitative means numerical measurement and qualitative means descriptive material expressed in words or images.
- Describing content analysis as a procedure with stages: sample the material, decide the coding categories, apply them systematically through the transcript, then count the frequency in each category.
- Offering a plausible category for the material named in the stem, such as counting each time an interviewee mentions a named emotion, so the conversion is anchored in that study.
- Naming what the conversion buys and what it costs, so frequencies allow comparison between participants and statistical testing while the richness of the original account is reduced.
- Bringing in reliability where the marks allow, such as a second researcher coding the same transcript so that inter rater reliability can be checked.
Common mistakes and how to put them right
Describing the conversion as simply counting words, with no categories agreed beforehand, which is not content analysis and earns little credit.
Saying that interviews give qualitative data and experiments give quantitative data, when a structured interview can produce numbers and an experiment can produce written accounts.
Evaluating the method instead of answering the question, so an item asking how a transcript could be quantified receives a paragraph on the strengths of interviews.
Forgetting that the frequencies produced are nominal data, then proposing a t test on them when Chi Square is the test those counts allow.
Exam tips
- The command is usually explain how or suggest how, so write the steps a researcher would actually carry out on the material named in the stem, in order.
- Use the study's own content and name the categories you would count in that particular transcript, because generic descriptions of content analysis score less.
- Explain conversion as an ordered process: define coding categories, apply them consistently, tally the frequencies and state what detail is lost when qualitative material becomes numerical.
- If the question asks you to evaluate the conversion, argue both sides: easier comparison and statistical testing against loss of meaning and the risk that the categories reflect the researcher's expectations.
Try the lesson
The start of the Handling data: Understand the differences between qualitative and quantitative data (to include: explaining how a given qualitative measure (for example, an interview transcript) might be converted into quantitative data) lesson, made from checked teaching notes for this specification point.
Have a go first
Which of the following best describes the fundamental difference between qualitative and quantitative data in psychological research?
Listen
Numbers that record how much or how many, such as reaction times, scores on a memory test or tallies of aggressive acts, are quantitative. Material expressed in words or images that carries meaning, such as what a participant said in an interview, an answer to an open question or a diary entry, is qualitative. The exam usually asks for the bridge between the two, and that bridge is content analysis. The researcher reads the material, agrees coding categories in advance, works through applying them, and counts how often each category appears, turning words into frequencies that can be graphed and tested with Chi Square. What is gained is comparison and statistical analysis; what is lost is the depth and the context of what was actually said. A strong answer earns marks for these points. Defining each type by what it is rather than by how it was gathered, so quantitative means numerical measurement and qualitative means descriptive material expressed in words or images. Describing content analysis as a procedure with stages: sample the material, decide the coding categories, apply them systematically through the transcript, then count the frequency in each category. Offering a plausible category for the material named in the stem, such as counting each time an interviewee mentions a named emotion, so the conversion is anchored in that study. Naming what the conversion buys and what it costs, so frequencies allow comparison between participants and statistical testing while the richness of the original account is reduced. Exam tip: The command is usually explain how or suggest how, so write the steps a researcher would actually carry out on the material named in the stem, in order.
See it
Key words
Say what each word means before you turn the card.
quantitative data
Try answering aloud or in your head before turning the card.
qualitative data
Try answering aloud or in your head before turning the card.
content analysis
Try answering aloud or in your head before turning the card.
loss of depth
Try answering aloud or in your head before turning the card.
See every definition
- quantitative data
- Numbers that record how much or how many, such as reaction times, scores on a memory test or tallies of aggressive acts.
- qualitative data
- Material expressed in words or images that carries meaning, such as what a participant said in an interview, an answer to an open question or a diary entry.
- content analysis
- The researcher reads the material, agrees coding categories in advance, applies them, and counts how often each category appears, turning words into frequencies.
- loss of depth
- What is lost in the conversion is the depth and the context of what was actually said.
Label the diagram
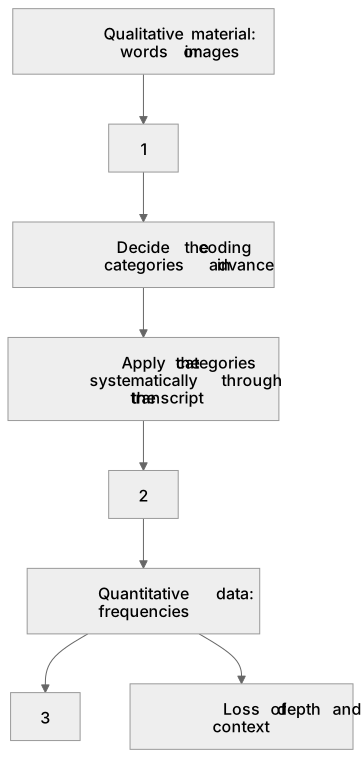
Some boxes have lost their names. Pick the right name for each number.
1Box 1
2Box 2
3Box 3
There is more to this lesson
The full lesson goes on to check your understanding and help you earn the marks. Create a free account to carry on, with your progress saved.
A week of Premium from your first lesson · Then the free plan continues · No card, no charge
Test your understanding of Handling data: Understand the differences between qualitative and quantitative data (to include: explaining how a given qualitative measure (for example, an interview transcript) might be converted into quantitative data)
Active recall beats re-reading. Take an instant quiz now to test what you’ve learned and lock it into long-term memory.
A week of Premium from your first lesson · Then the free plan continues · No card, no charge