Pearson Edexcel · GCSE · Psychology
Course version: 1PS0 · Version from Sept 2017
Designing psychological research: 11.1.14 correlation
A correlation is a research method used to investigate the relationship between two co-variables, rather than looking for a cause-and-effect relationship.
Checked against the Pearson Edexcel 1PS0 specification (opens in a new tab) on .
- Point 15 of 17
- 4 key terms
Study notes
From the checked teaching notes for this specification point.
The idea
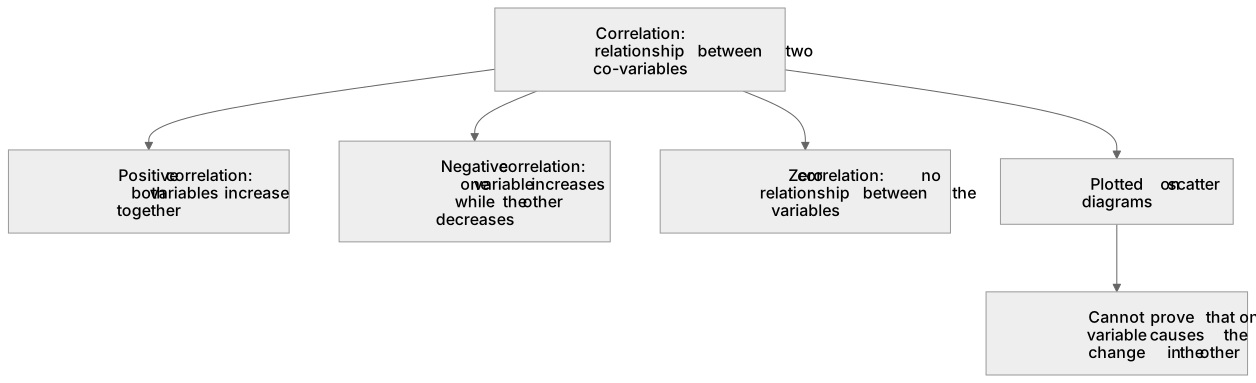
A correlation is a research method used to investigate the relationship between two co-variables, rather than looking for a cause-and-effect relationship. Researchers measure both variables to see if they change together. A positive correlation occurs when both variables increase together, such as hours spent revising and test scores. A negative correlation occurs when one variable increases while the other decreases, for example, school absences and exam performance. Zero correlation means there is no relationship between the variables. Correlations are plotted on scatter diagrams to visualise the strength and direction of the relationship, but crucially, they cannot prove that one variable causes the change in the other.
What earns the marks
- Define correlation as a measure of the relationship between two co-variables.
- Identify a positive correlation as both variables increasing together.
- Identify a negative correlation as one variable increasing while the other decreases.
- State that a zero correlation indicates no relationship between the co-variables.
- Explain that correlation does not establish cause and effect.
Common mistakes and how to put them right
Confusing correlation with causation.
Put it right by stating that a correlation only shows a relationship, not that one variable causes the other to change.
Using the terms 'independent variable' and 'dependent variable' for correlations.
Put it right by using the term 'co-variables'.
Misinterpreting a negative correlation as 'no correlation'.
Put it right by explaining that a negative correlation is a specific inverse relationship, whereas zero correlation means no relationship.
Exam tips
- Always use the term 'co-variables' rather than independent and dependent variables when describing correlational research.
- When interpreting a scatter diagram, explicitly state the direction of the correlation as positive, negative, or zero.
- If asked for a limitation of a correlational study, always mention the inability to establish cause and effect.
Try the lesson
The start of the Designing psychological research: 11.1.14 correlation lesson, made from checked teaching notes for this specification point.
Have a go first
A researcher wants to investigate the relationship between the number of hours students spend revising and their final exam scores. Which research method is most appropriate for this investigation?
Listen
A correlation is a research method used to investigate the relationship between two co-variables, rather than looking for a cause-and-effect relationship. Researchers measure both variables to see if they change together. A positive correlation occurs when both variables increase together, such as hours spent revising and test scores. A negative correlation occurs when one variable increases while the other decreases, for example, school absences and exam performance. Zero correlation means there is no relationship between the variables. Correlations are plotted on scatter diagrams to visualise the strength and direction of the relationship, but crucially, they cannot prove that one variable causes the change in the other. A strong answer earns marks for these points. Define correlation as a measure of the relationship between two co-variables. Identify a positive correlation as both variables increasing together. Identify a negative correlation as one variable increasing while the other decreases. State that a zero correlation indicates no relationship between the co-variables. A common slip: Confusing correlation with causation. Instead, stating that a correlation only shows a relationship, not that one variable causes the other to change. Exam tip: Always use the term 'co-variables' rather than independent and dependent variables when describing correlational research.
See it
Key words
Say what each word means before you turn the card.
Co-variables
Try answering aloud or in your head before turning the card.
Positive correlation
Try answering aloud or in your head before turning the card.
Negative correlation
Try answering aloud or in your head before turning the card.
Zero correlation
Try answering aloud or in your head before turning the card.
See every definition
- Co-variables
- The two variables measured in a correlation, which are investigated to see if they change together.
- Positive correlation
- A relationship where both variables increase together, such as hours spent revising and test scores.
- Negative correlation
- A relationship where one variable increases while the other decreases, for example, school absences and exam performance.
- Zero correlation
- A result indicating that there is no relationship between the variables.
Label the diagram
Some boxes have lost their names. Pick the right name for each number.
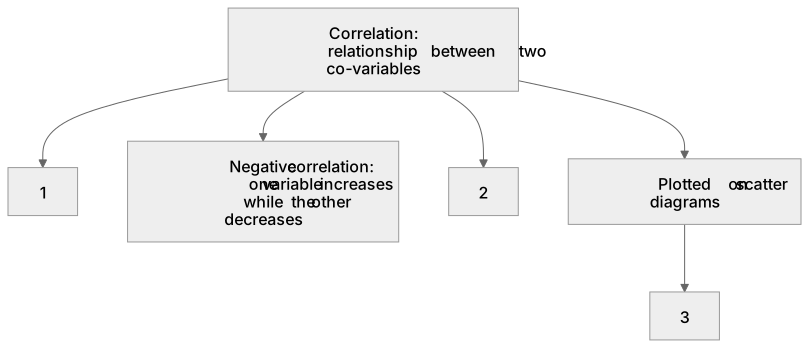
1Box 1
2Box 2
3Box 3
There is more to this lesson
The full lesson goes on to check your understanding and help you earn the marks. Create a free account to carry on, with your progress saved.
A week of Premium from your first lesson · Then the free plan continues · No card, no charge
Test your understanding of Designing psychological research: 11.1.14 correlation
Active recall beats re-reading. Take an instant quiz now to test what you’ve learned and lock it into long-term memory.
A week of Premium from your first lesson · Then the free plan continues · No card, no charge