AQA · GCSE · Biology
Course version: 8461 · Version from Sept 2018
Students should be able to: • measure and calculate rates of…
Full specification wording
Rate of photosynthesis: Students should be able to: • measure and calculate rates of photosynthesis • extract and interpret graphs of photosynthesis rate involving one limiting factor • plot and draw appropriate graphs selecting appropriate scale for axes • translate information between graphical and numeric form.
Photosynthesis rate is the speed at which a plant produces oxygen or uses carbon dioxide.
Checked against the AQA 8461 specification (opens in a new tab) on .
- Point 2 of 9
Study notes
From the checked teaching notes for this specification point.
The idea
Photosynthesis rate is the speed at which a plant produces oxygen or uses carbon dioxide. A common method uses pondweed: count bubbles per minute, or collect gas in a syringe to record volume per minute. Rate is calculated by dividing gas volume by time, e.g., 12 cm³ ÷ 4 min = 3 cm³/min. Graphs show rate against light intensity, carbon dioxide concentration or temperature. For light and CO₂, the line rises steeply then levels off (plateaus) when another factor becomes limiting. However, for temperature, the rate peaks at an optimum then falls sharply as enzymes denature. When plotting, choose a scale using most of the grid, label axes with units, and plot accurately.
What earns the marks
- State that rate of photosynthesis can be measured by the volume of oxygen produced per unit time or the volume of carbon dioxide taken in per unit time.
- Calculate rate using rate = volume of gas ÷ time, with correct units such as cm³/min or cm³ s⁻¹.
- Describe a valid method, for example using pondweed and counting bubbles per minute or collecting gas in a capillary tube or syringe.
- Interpret a graph of rate against one limiting factor by identifying the initial rise and the plateau for light or CO₂, or the peak and subsequent fall for temperature due to enzyme denaturation.
- Select an appropriate scale for axes so that plotted points occupy most of the grid and are easy to read.
- Translate between graphical and numeric form by reading a rate from a curve at a stated value or estimating a value from a plotted line.
Common mistakes and how to put them right
Confusing rate with total gas volume.
Put it right: Rate must be divided by time, so a reading of 30 cm³ after 5 minutes gives 6 cm³/min, not 30 cm³/min.
Plotting points without choosing a scale that fills the grid, which compresses the curve and makes interpretation difficult.
Put it right: Choose a scale where each major grid square represents a sensible round number.
Assuming all graphs plateau.
Put it right: While light and CO₂ graphs level off when another factor limits the rate, temperature graphs fall after the optimum because enzymes denature.
Exam tips
- Always include units when stating a rate, for example cm³/min, and show the division by time in your working.
- When describing a graph, quote figures from the axes to support the trend, such as rate rising from 2 cm³/min at 10 °C to 8 cm³/min at 25 °C.
- For graph-plotting questions, check that the scale is uniform, axes are labelled with quantity and unit, and points are plotted within half a small square.
Try the lesson
The start of the Rate of photosynthesis: Students should be able to: • measure and calculate rates of photosynthesis • extract and interpret graphs of photosynthesis rate involving one limiting factor • plot and draw appropriate graphs selecting appropriate scale for axes • translate information between graphical and numeric form. lesson, made from checked teaching notes for this specification point.
Have a go first
A pondweed releases 24 cm³ of oxygen in 4 minutes. What is the rate of oxygen production in cm³ per minute?
Listen
Photosynthesis rate is the speed at which a plant produces oxygen or uses carbon dioxide. A common method uses pondweed: count bubbles per minute, or collect gas in a syringe to record volume per minute. Rate is calculated by dividing gas volume by time, e.g., 12 cm³ ÷ 4 min = 3 cm³/min. Graphs show rate against light intensity, carbon dioxide concentration or temperature. For light and CO₂, the line rises steeply then levels off (plateaus) when another factor becomes limiting. However, for temperature, the rate peaks at an optimum then falls sharply as enzymes denature. When plotting, choose a scale using most of the grid, label axes with units, and plot accurately. A strong answer earns marks for these points. State that rate of photosynthesis can be measured by the volume of oxygen produced per unit time or the volume of carbon dioxide taken in per unit time. Calculate rate using rate = volume of gas ÷ time, with correct units such as cm³/min or cm³ s⁻¹. Describe a valid method, for example using pondweed and counting bubbles per minute or collecting gas in a capillary tube or syringe. Interpret a graph of rate against one limiting factor by identifying the initial rise and the plateau for light or CO₂, or the peak and subsequent fall for temperature due to enzyme denaturation. Exam tip: Always include units when stating a rate, for example cm³/min, and show the division by time in your working.
See it
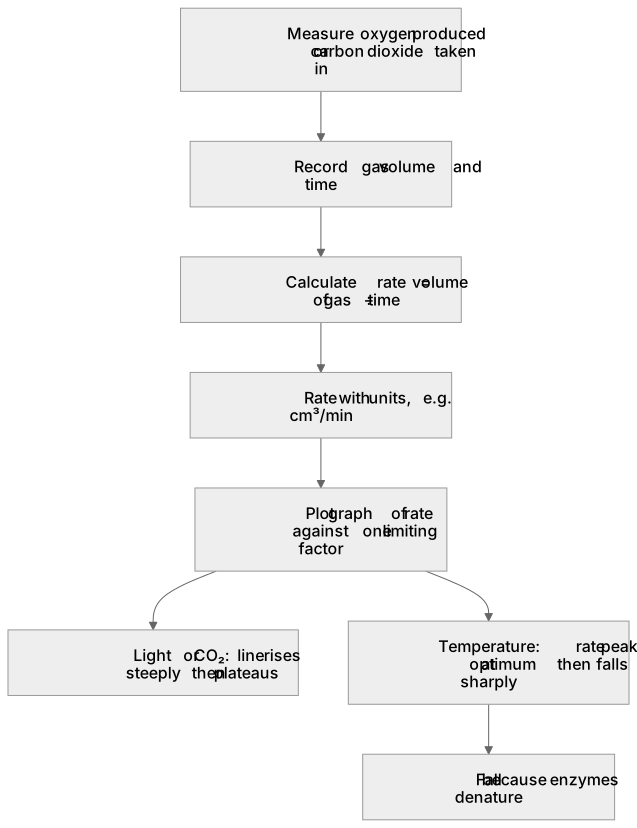
Label the diagram
Some boxes have lost their names. Pick the right name for each number.
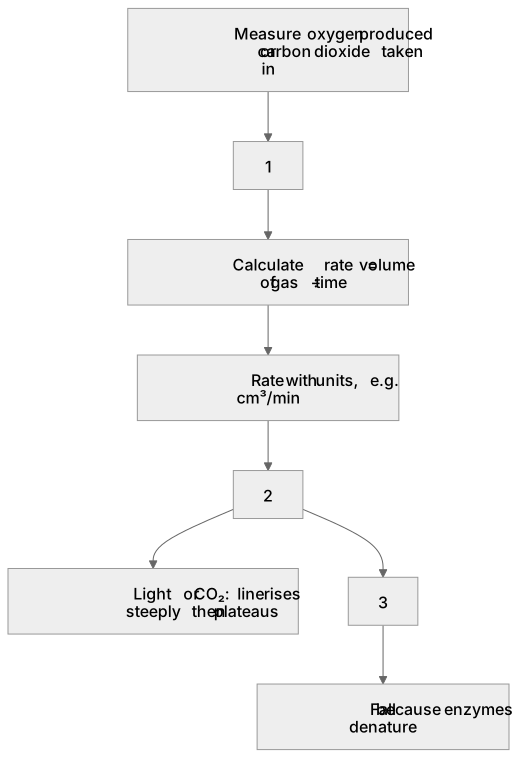
1Box 1
2Box 2
3Box 3
There is more to this lesson
The full lesson goes on to check your understanding and help you earn the marks. Create a free account to carry on, with your progress saved.
A week of Premium from your first lesson · Then the free plan continues · No card, no charge
Test your understanding of Rate of photosynthesis: Students should be able to: • measure and calculate rates of photosynthesis • extract and interpret graphs of photosynthesis rate involving one limiting factor • plot and draw appropriate graphs selecting appropriate scale for axes • translate information between graphical and numeric form.
Active recall beats re-reading. Take an instant quiz now to test what you’ve learned and lock it into long-term memory.
A week of Premium from your first lesson · Then the free plan continues · No card, no charge