OCR · GCSE · Biology
Course version: J247 · Version from Sept 2018
Extract and interpret information from charts, graphs and tables
Full specification wording
Feeding the human race: extract and interpret information from charts, graphs and tables
Interpreting agricultural and food production data requires quantitative analysis of yield curves, resource efficiency comparisons, and demographic food demand projections.
- Point 1 of 8
- 4 key terms
Study notes
From the teaching notes for this specification point.
The idea
Interpreting agricultural and food production data requires quantitative analysis of yield curves, resource efficiency comparisons, and demographic food demand projections. Evaluating tables comparing meat production against cereal farming illustrates energy losses across trophic levels, reinforcing why plant-based diets are more energy efficient.
What earns the marks
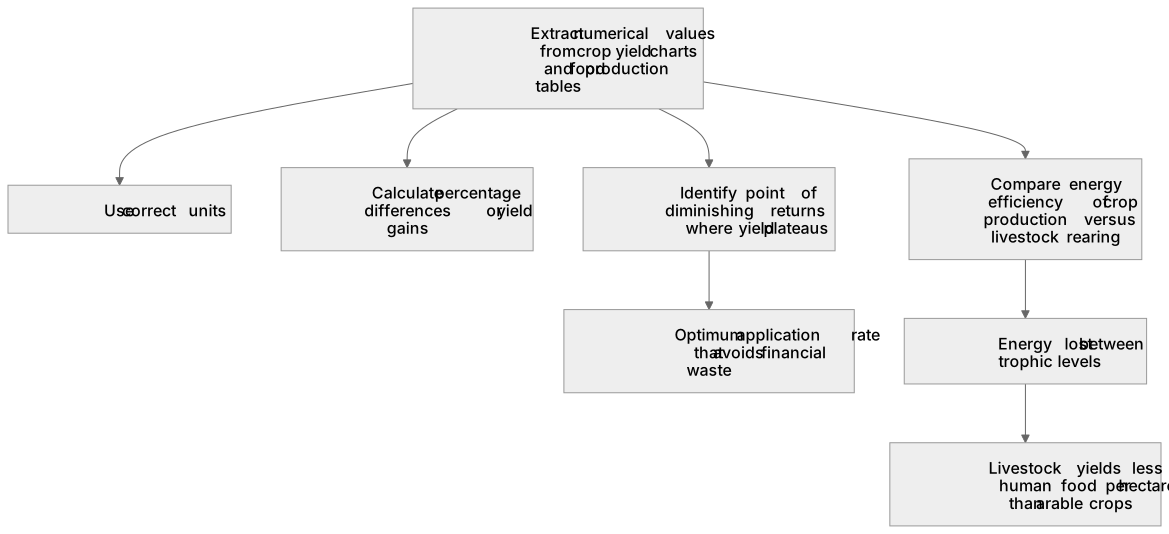
- Extract numerical values accurately from crop yield charts and food production tables with correct units.
- Calculate percentage differences or yield gains achieved by applying agricultural treatments.
- Identify the point of diminishing returns on fertiliser response graphs where yield plateaus.
- Use data to compare the energy efficiency of crop production versus livestock rearing across trophic levels.
Common mistakes and how to put them right
Assuming crop yield increases indefinitely with increasing fertiliser application, ignoring toxicity and plateau effects.
Confusing raw yield differences with percentage increases when comparing agricultural outputs.
Exam tips
- Look for where a fertiliser curve flattens out to identify the optimum application rate that avoids financial waste.
- Remember that 90% of energy is lost between trophic levels, so raising livestock yields far less human food per hectare than growing arable crops.
Try the lesson
The start of the Feeding the human race: extract and interpret information from charts, graphs and tables lesson, made from teaching notes for this specification point.
Have a go first
A table shows the mass of wheat harvested from four fields, each of the same area: Field A 4 tonnes, Field B 6 tonnes, Field C 5 tonnes and Field D 9 tonnes. Which field gave the largest wheat harvest?
Listen
Interpreting agricultural and food production data requires quantitative analysis of yield curves, resource efficiency comparisons, and demographic food demand projections. Evaluating tables comparing meat production against cereal farming illustrates energy losses across trophic levels, reinforcing why plant-based diets are more energy efficient. A strong answer earns marks for these points. Extract numerical values accurately from crop yield charts and food production tables with correct units. Calculate percentage differences or yield gains achieved by applying agricultural treatments. Identify the point of diminishing returns on fertiliser response graphs where yield plateaus. Use data to compare the energy efficiency of crop production versus livestock rearing across trophic levels. Exam tip: Look for where a fertiliser curve flattens out to identify the optimum application rate that avoids financial waste.
See it
Key words
Say what each word means before you turn the card.
food production data
Try answering aloud or in your head before turning the card.
crop yield optimisation
Try answering aloud or in your head before turning the card.
trophic level efficiency
Try answering aloud or in your head before turning the card.
agricultural economics
Try answering aloud or in your head before turning the card.
See every definition
- food production data
- Information taken from charts, graphs and tables about agricultural and food production, from which numerical values must be extracted accurately with correct units.
- crop yield optimisation
- Identifying the point of diminishing returns on fertiliser response graphs where yield plateaus, giving the optimum application rate that avoids financial waste.
- trophic level efficiency
- Comparing the energy efficiency of crop production versus livestock rearing across trophic levels, where 90% of energy is lost between trophic levels.
- agricultural economics
- Determining the point of diminishing returns where adding fertiliser yields no economic benefit, so the optimum application rate avoids financial waste.
Label the diagram
Some boxes have lost their names. Pick the right name for each number.
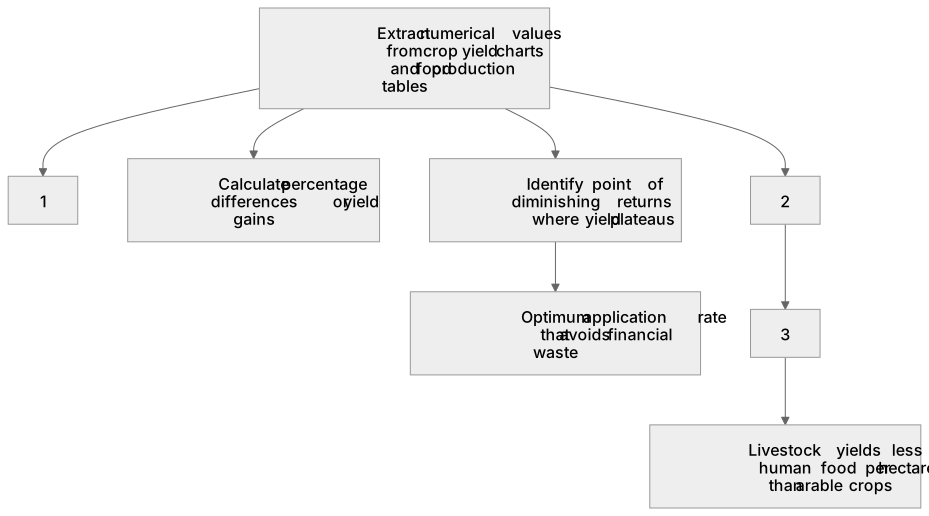
1Box 1
2Box 2
3Box 3
There is more to this lesson
The full lesson goes on to check your understanding and help you earn the marks. Create a free account to carry on, with your progress saved.
A week of Premium from your first lesson · Then the free plan continues · No card, no charge
Test your understanding of Feeding the human race: extract and interpret information from charts, graphs and tables
Active recall beats re-reading. Take an instant quiz now to test what you’ve learned and lock it into long-term memory.
A week of Premium from your first lesson · Then the free plan continues · No card, no charge