OCR · GCSE · Biology
Course version: J247 · Version from Sept 2018
Monitoring and maintaining the environment: calculate arithmetic means
Calculating arithmetic means is an essential quantitative skill in ecological fieldwork and laboratory biology.
- Point 1 of 9
Study notes
From the teaching notes for this specification point.
The idea
Calculating arithmetic means is an essential quantitative skill in ecological fieldwork and laboratory biology. When determining the mean abundance of plant species per quadrat or measuring abiotic variables like soil pH and light intensity, all valid repeat measurements are summed and divided by the number of samples.
What earns the marks
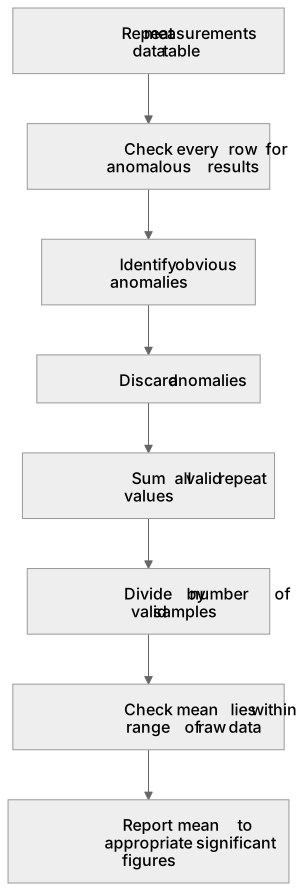
- Sum all valid repeat values and divide by the total number of non-anomalous samples.
- Identify and discard obvious anomalous results before computing the arithmetic mean.
- Express the final calculated mean to an appropriate number of significant figures matching the raw data.
Common mistakes and how to put them right
Including obvious anomalous numbers in the sum when calculating the mean, distorting the final value.
Dividing by the total number of original trials rather than the number of valid trials remaining after excluding anomalies.
Exam tips
- Check every row of data for numbers that differ markedly from other repeats, circle them as anomalies, and omit them from your calculation.
- Always check that your calculated mean lies within the range of the raw data values.
Try the lesson
The start of the Monitoring and maintaining the environment: calculate arithmetic means lesson, made from teaching notes for this specification point.
Have a go first
A student records the number of dandelions in five 1m² quadrats: 4, 9, 5, 3, 9. Calculate the arithmetic mean number of dandelions per quadrat.
Listen
Calculating arithmetic means is an essential quantitative skill in ecological fieldwork and laboratory biology. When determining the mean abundance of plant species per quadrat or measuring abiotic variables like soil pH and light intensity, all valid repeat measurements are summed and divided by the number of samples. A strong answer earns marks for these points. Sum all valid repeat values and divide by the total number of non-anomalous samples. Identify and discard obvious anomalous results before computing the arithmetic mean. Express the final calculated mean to an appropriate number of significant figures matching the raw data. Exam tip: Check every row of data for numbers that differ markedly from other repeats, circle them as anomalies, and omit them from your calculation.
See it
Put it in order
Put these steps in the order they happen.
- 1. Sum all valid repeat values
- 2. Report mean to appropriate significant figures
- 3. Divide by number of valid samples
- 4. Repeat measurements in data table
- 5. Check every row for anomalous results
- 6. Check mean lies within range of raw data
- 7. Identify obvious anomalies
- 8. Discard anomalies
Label the diagram
Some boxes have lost their names. Pick the right name for each number.
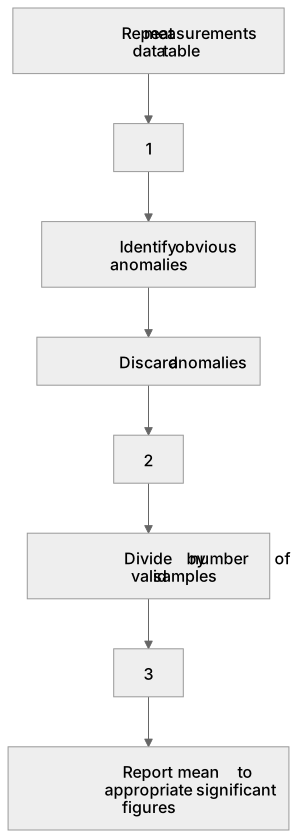
1Box 1
2Box 2
3Box 3
There is more to this lesson
The full lesson goes on to check your understanding and help you earn the marks. Create a free account to carry on, with your progress saved.
A week of Premium from your first lesson · Then the free plan continues · No card, no charge
Test your understanding of Monitoring and maintaining the environment: calculate arithmetic means
Active recall beats re-reading. Take an instant quiz now to test what you’ve learned and lock it into long-term memory.
A week of Premium from your first lesson · Then the free plan continues · No card, no charge