OCR · GCSE · Biology
Course version: J247 · Version from Sept 2018
Extract and interpret information from graphs, charts and tables
Full specification wording
Photosynthesis: extract and interpret information from graphs, charts and tables
Interpreting photosynthesis data involves analyzing trends and identifying limiting factors from charts and graphs.
- Point 4 of 15
- 4 key terms
Study notes
From the teaching notes for this specification point.
The idea
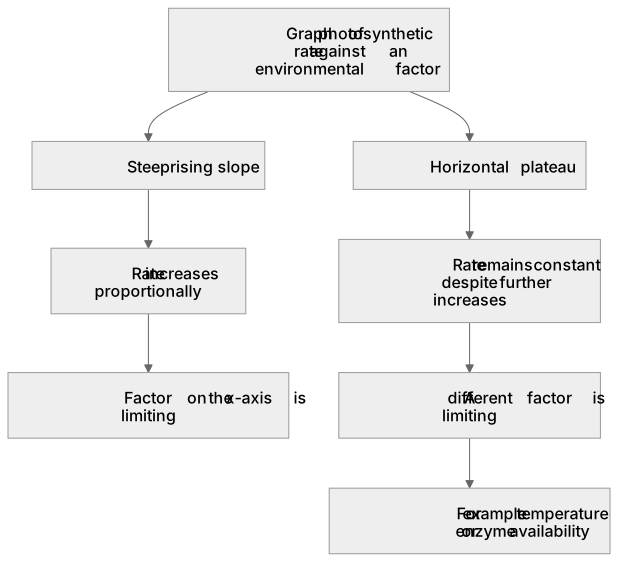
Interpreting photosynthesis data involves analyzing trends and identifying limiting factors from charts and graphs. When plotting photosynthetic rate against an environmental factor such as light intensity or carbon dioxide concentration, the graph displays two distinct zones. On the initial steep upward slope, rate increases proportionally, demonstrating that the factor on the x-axis is limiting the reaction. When the curve flattens into a horizontal plateau, rate remains constant despite further increases, indicating that a different factor, such as temperature or enzyme availability, has become limiting.
What earns the marks
- Identifying that on the steep rising part of the graph the factor on the x-axis is the limiting factor.
- Identifying that on the plateau region a factor other than the one on the x-axis is limiting rate.
- Extracting and comparing quantitative values from tables and curves to support biological conclusions.
Common mistakes and how to put them right
Claiming the reaction has stopped when the graph line becomes horizontal, rather than recognizing it continues at a constant maximum rate.
Attributing a plateau to the factor on the x-axis running out rather than a different environmental factor becoming limiting.
Exam tips
- Divide the curve into two sections: rising slope where x is limiting, and plateau where another factor limits.
- Quote specific data pairs (with units) from the graph when asked to describe or interpret the observed trend.
Try the lesson
The start of the Photosynthesis: extract and interpret information from graphs, charts and tables lesson, made from teaching notes for this specification point.
Have a go first
A table shows that pondweed produces 6 bubbles per minute at 10 °C and 12 bubbles per minute at 20 °C. What happens to the rate of photosynthesis as the temperature rises from 10 °C to 20 °C?
Listen
Interpreting photosynthesis data involves analyzing trends and identifying limiting factors from charts and graphs. When plotting photosynthetic rate against an environmental factor such as light intensity or carbon dioxide concentration, the graph displays two distinct zones. On the initial steep upward slope, rate increases proportionally, demonstrating that the factor on the x-axis is limiting the reaction. When the curve flattens into a horizontal plateau, rate remains constant despite further increases, indicating that a different factor, such as temperature or enzyme availability, has become limiting. A strong answer earns marks for these points. identifying that on the steep rising part of the graph the factor on the x-axis is the limiting factor. identifying that on the plateau region a factor other than the one on the x-axis is limiting rate. extracting and comparing quantitative values from tables and curves to support biological conclusions. Exam tip: Divide the curve into two sections: rising slope where x is limiting, and plateau where another factor limits.
See it
Key words
Say what each word means before you turn the card.
limiting factors
Try answering aloud or in your head before turning the card.
trend interpretation
Try answering aloud or in your head before turning the card.
plateau region
Try answering aloud or in your head before turning the card.
data extraction
Try answering aloud or in your head before turning the card.
See every definition
- limiting factors
- On the steep rising part of the graph the factor on the x-axis is limiting the reaction, while on the plateau a different factor has become limiting.
- trend interpretation
- Analysing trends involves dividing the curve into a rising slope where x is limiting and a plateau where another factor limits.
- plateau region
- On the plateau region the rate remains constant despite further increases, indicating that a factor other than the one on the x-axis is limiting rate.
- data extraction
- Extracting and comparing quantitative values from tables and curves supports biological conclusions, quoting specific data pairs with units.
Label the diagram
Some boxes have lost their names. Pick the right name for each number.
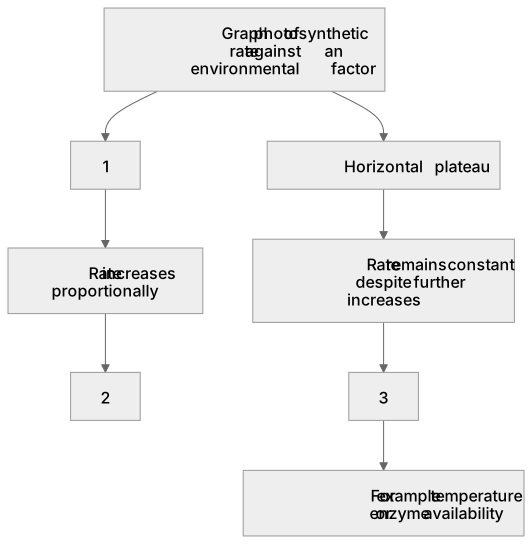
1Box 1
2Box 2
3Box 3
There is more to this lesson
The full lesson goes on to check your understanding and help you earn the marks. Create a free account to carry on, with your progress saved.
A week of Premium from your first lesson · Then the free plan continues · No card, no charge
Test your understanding of Photosynthesis: extract and interpret information from graphs, charts and tables
Active recall beats re-reading. Take an instant quiz now to test what you’ve learned and lock it into long-term memory.
A week of Premium from your first lesson · Then the free plan continues · No card, no charge