OCR · GCSE · Biology
Course version: J247 · Version from Sept 2018
Photosynthesis: translate information between graphical and numerical form
Photosynthesis questions require students to translate information between numerical data tables and graphical representations.
- Point 2 of 15
- 4 key terms
Study notes
From the teaching notes for this specification point.
The idea
Photosynthesis questions require students to translate information between numerical data tables and graphical representations. This includes converting raw experimental readings into coordinates, plotting points accurately on a grid, and reading corresponding values from curves. For instance, determining the light intensity at which the photosynthetic rate reaches its plateau requires reading the x-coordinate where the curve becomes horizontal. Similarly, extracting numerical rates at specific temperatures enables students to calculate rate ratios or percentage differences across experimental conditions.
What earns the marks
- Extracting coordinates accurately from photosynthesis rate curves.
- Translating tabular values into plotted points on a coordinate grid.
- Calculating numerical differences or percentage changes between data extracted from graphs.
Common mistakes and how to put them right
Misreading graph scales, such as misinterpreting five small squares representing 10 units as single units.
Reading values from the wrong curve when multiple curves (e.g. at differing CO₂ levels) are plotted on one set of axes.
Exam tips
- Draw construction lines with a pencil and ruler directly on the graph to ensure accurate coordinate readings.
- Check axis labels and units carefully before reading numerical values.
Try the lesson
The start of the Photosynthesis: translate information between graphical and numerical form lesson, made from teaching notes for this specification point.
Have a go first
A graph shows the volume of oxygen produced by pondweed against time. The line is straight and passes through the origin. At 2 minutes the volume is 6 cm³. What volume is produced at 4 minutes?
Listen
Photosynthesis questions require students to translate information between numerical data tables and graphical representations. This includes converting raw experimental readings into coordinates, plotting points accurately on a grid, and reading corresponding values from curves. For instance, determining the light intensity at which the photosynthetic rate reaches its plateau requires reading the x-coordinate where the curve becomes horizontal. Similarly, extracting numerical rates at specific temperatures enables students to calculate rate ratios or percentage differences across experimental conditions. A strong answer earns marks for these points. extracting coordinates accurately from photosynthesis rate curves. translating tabular values into plotted points on a coordinate grid. calculating numerical differences or percentage changes between data extracted from graphs. Exam tip: Draw construction lines with a pencil and ruler directly on the graph to ensure accurate coordinate readings.
See it
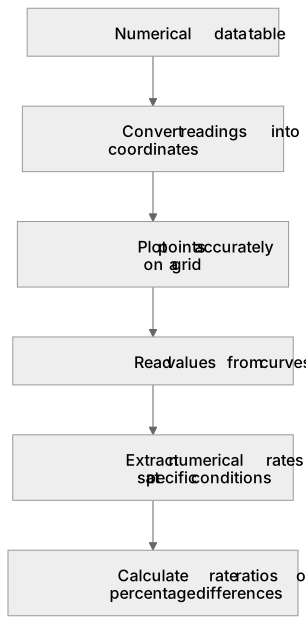
Put it in order
Put these steps in the order they happen.
- 1. Plot points accurately on a grid
- 2. Convert readings into coordinates
- 3. Numerical data table
- 4. Calculate rate ratios or percentage differences
- 5. Extract numerical rates at specific conditions
- 6. Read values from curves
Key words
Say what each word means before you turn the card.
data translation
Try answering aloud or in your head before turning the card.
graphical interpretation
Try answering aloud or in your head before turning the card.
coordinate extraction
Try answering aloud or in your head before turning the card.
photosynthesis graphs
Try answering aloud or in your head before turning the card.
See every definition
- data translation
- Moving information between numerical data tables and graphical representations, such as converting raw experimental readings into coordinates and plotting points accurately on a grid.
- graphical interpretation
- Reading corresponding values from curves, including determining the light intensity at which the photosynthetic rate reaches its plateau by reading the x-coordinate where the curve becomes horizontal.
- coordinate extraction
- Accurately extracting coordinates from photosynthesis rate curves, and translating tabular values into plotted points on a coordinate grid.
- photosynthesis graphs
- Graphs from which numerical data is extracted accurately, and from which extracted values are used to calculate rates and percentage changes.
Label the diagram
Some boxes have lost their names. Pick the right name for each number.
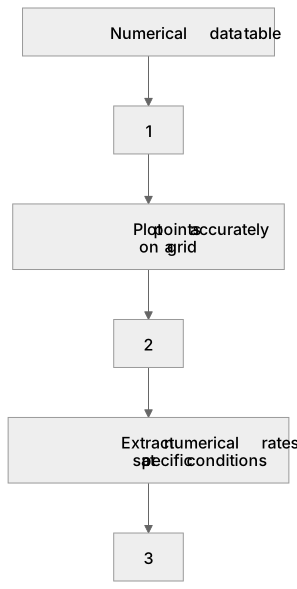
1Box 1
2Box 2
3Box 3
There is more to this lesson
The full lesson goes on to check your understanding and help you earn the marks. Create a free account to carry on, with your progress saved.
A week of Premium from your first lesson · Then the free plan continues · No card, no charge
Test your understanding of Photosynthesis: translate information between graphical and numerical form
Active recall beats re-reading. Take an instant quiz now to test what you’ve learned and lock it into long-term memory.
A week of Premium from your first lesson · Then the free plan continues · No card, no charge