
Study Notes

Overview
Ratio analysis is a fundamental quantitative skill in business, allowing for the assessment of a firm's financial health and performance over time. For WJEC GCSE Business candidates, mastering the calculation and interpretation of profitability ratios is non-negotiable. This study guide focuses on the two core profitability ratios you will be tested on: Gross Profit Margin (GPM) and Net Profit Margin (NPM). Examiners expect candidates to not only perform the calculations accurately (to two decimal places) but, more importantly, to use the results to analyse business performance within a given case study context. This means explaining what the percentages signify about a firm's efficiency, its control over costs, and its overall profitability. High marks are awarded to students who can connect changes in these ratios to specific business activities, such as a change in suppliers or an increase in marketing expenditure, thereby demonstrating a deeper understanding of the interplay between business operations and financial outcomes.
Key Concepts: Profitability Ratios
Gross Profit Margin (GPM)
What it measures: GPM assesses how efficiently a business is converting revenue into gross profit. It focuses specifically on the cost of sales, which are the direct costs associated with producing or purchasing the goods sold by the business.
Formula: Gross Profit / Revenue x 100
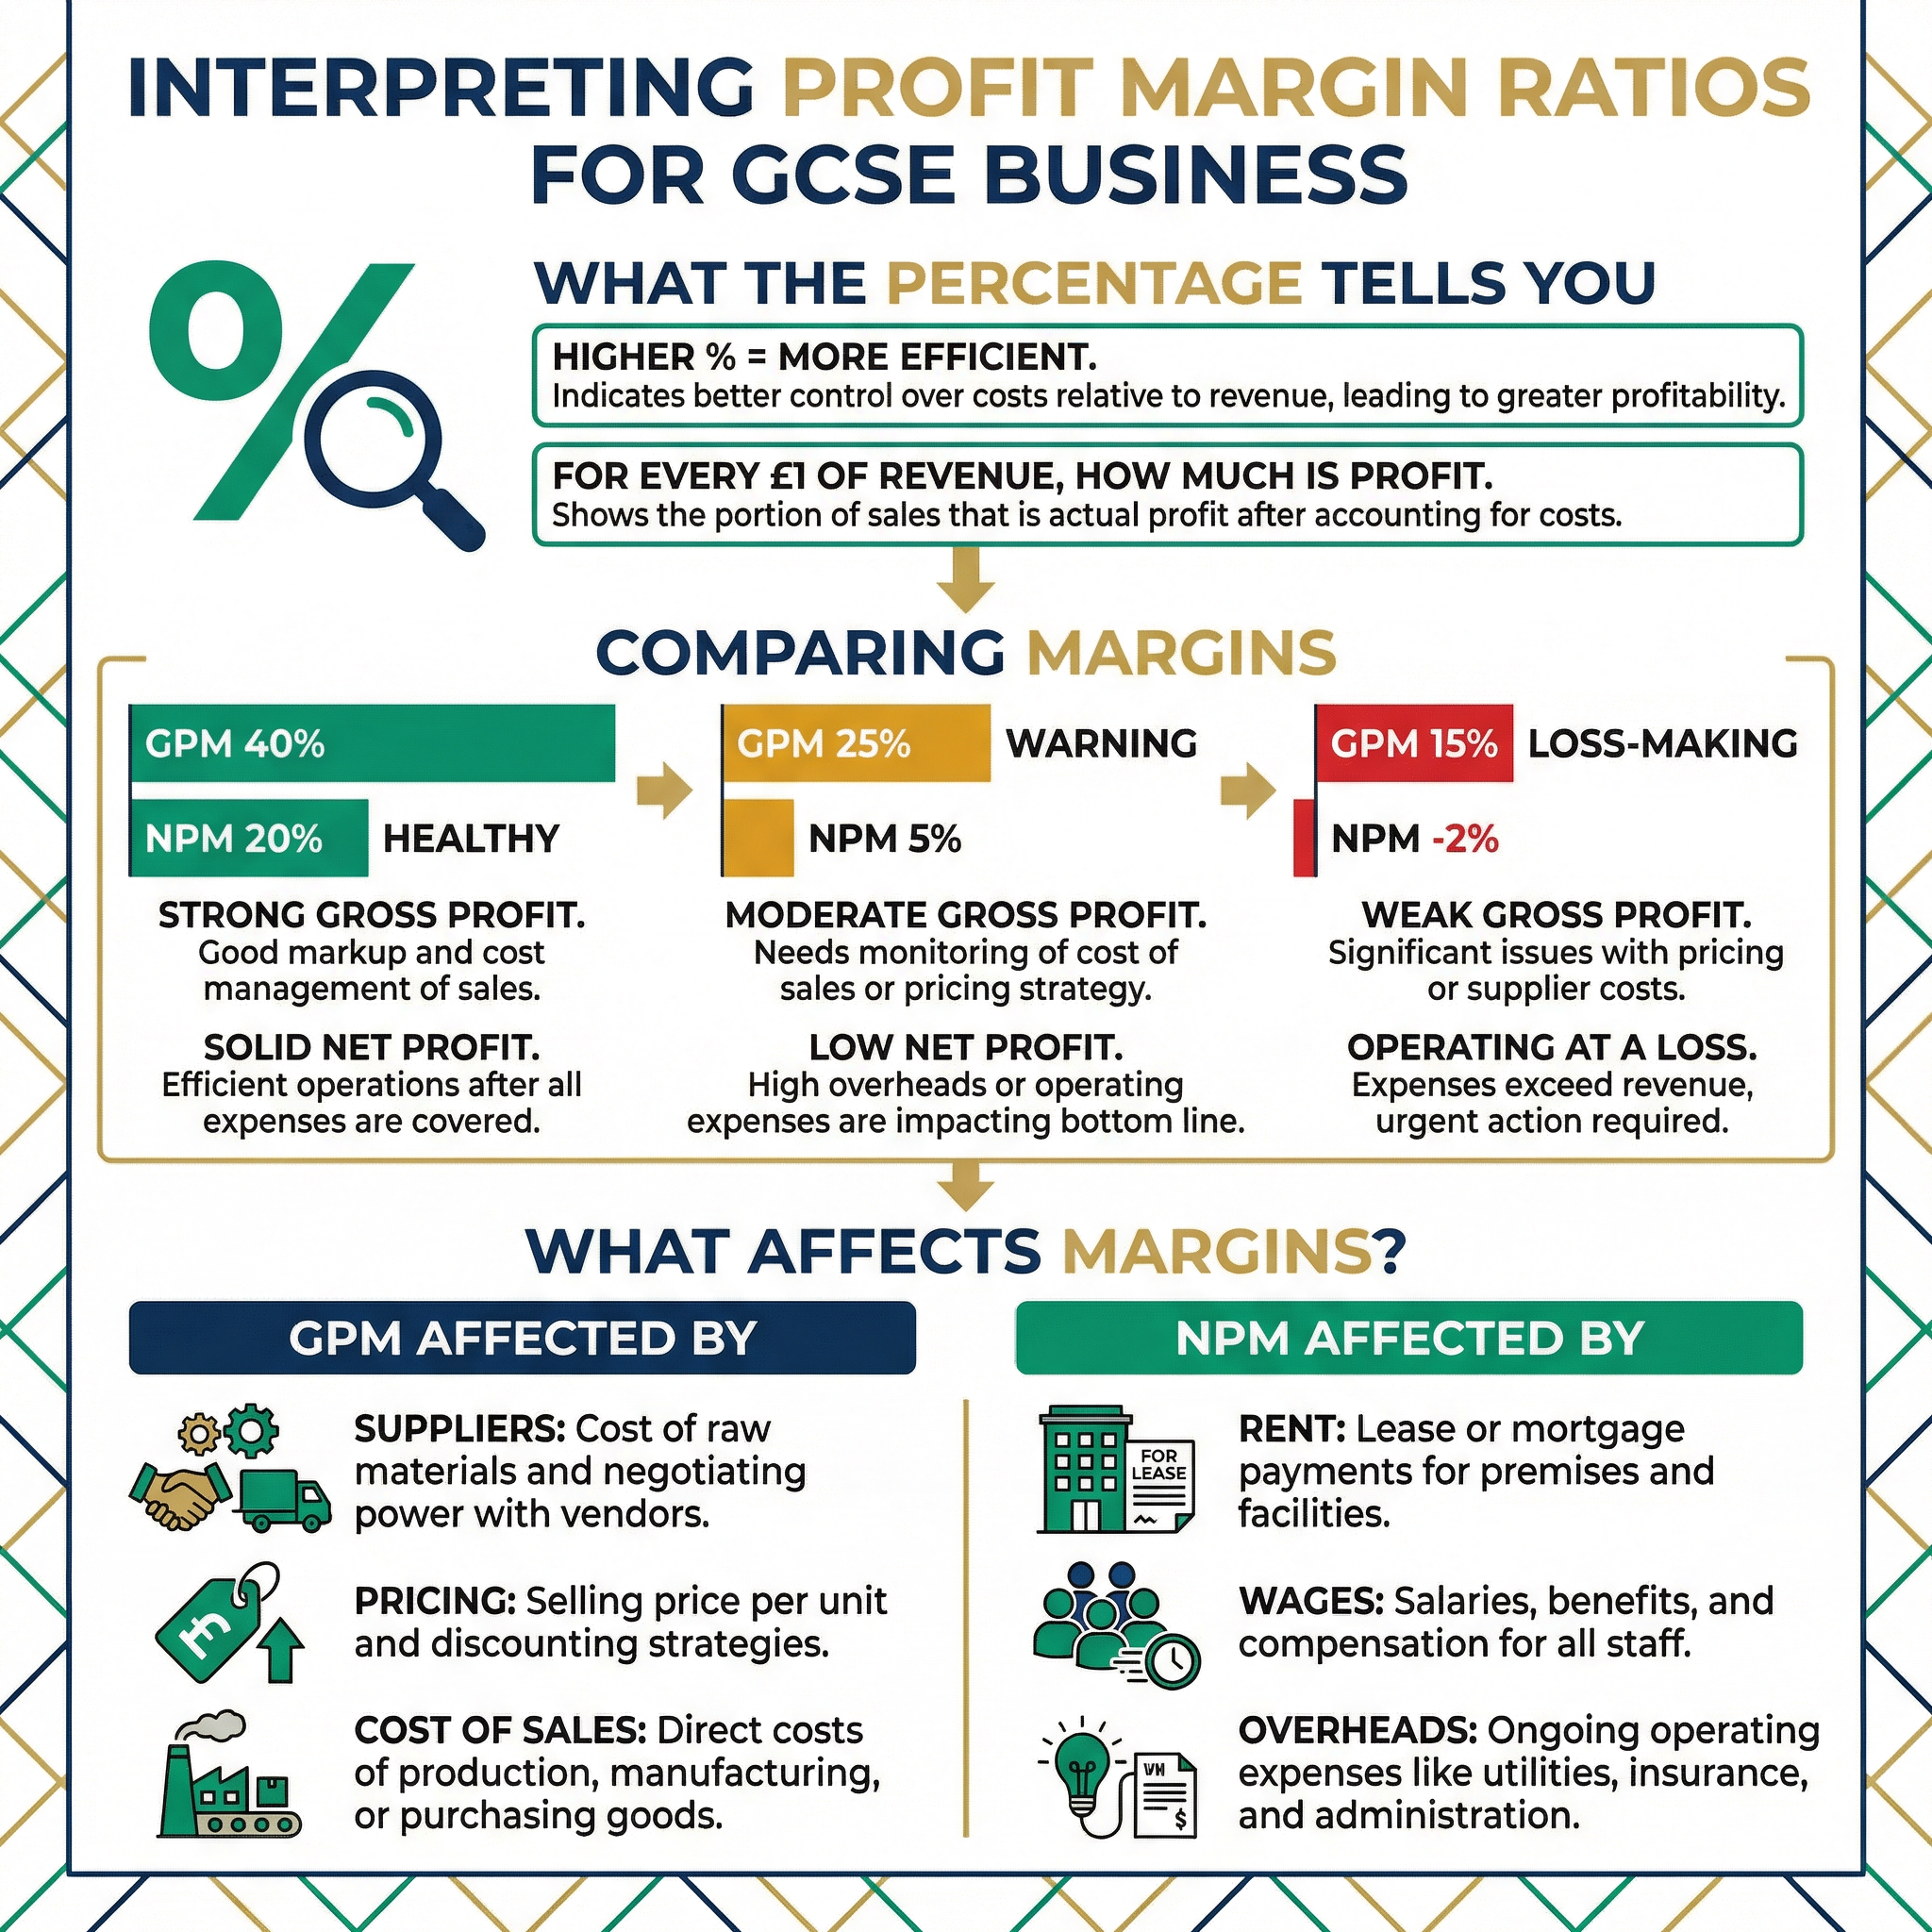
Why it matters: A high GPM indicates that a business has a healthy markup on its products and is effectively managing its direct costs. A falling GPM might suggest that the cost of raw materials has increased, or that the business has been forced to lower its prices.
Specific Knowledge: Candidates must know the formula and be able to calculate Gross Profit (Revenue - Cost of Sales) if it is not provided directly.
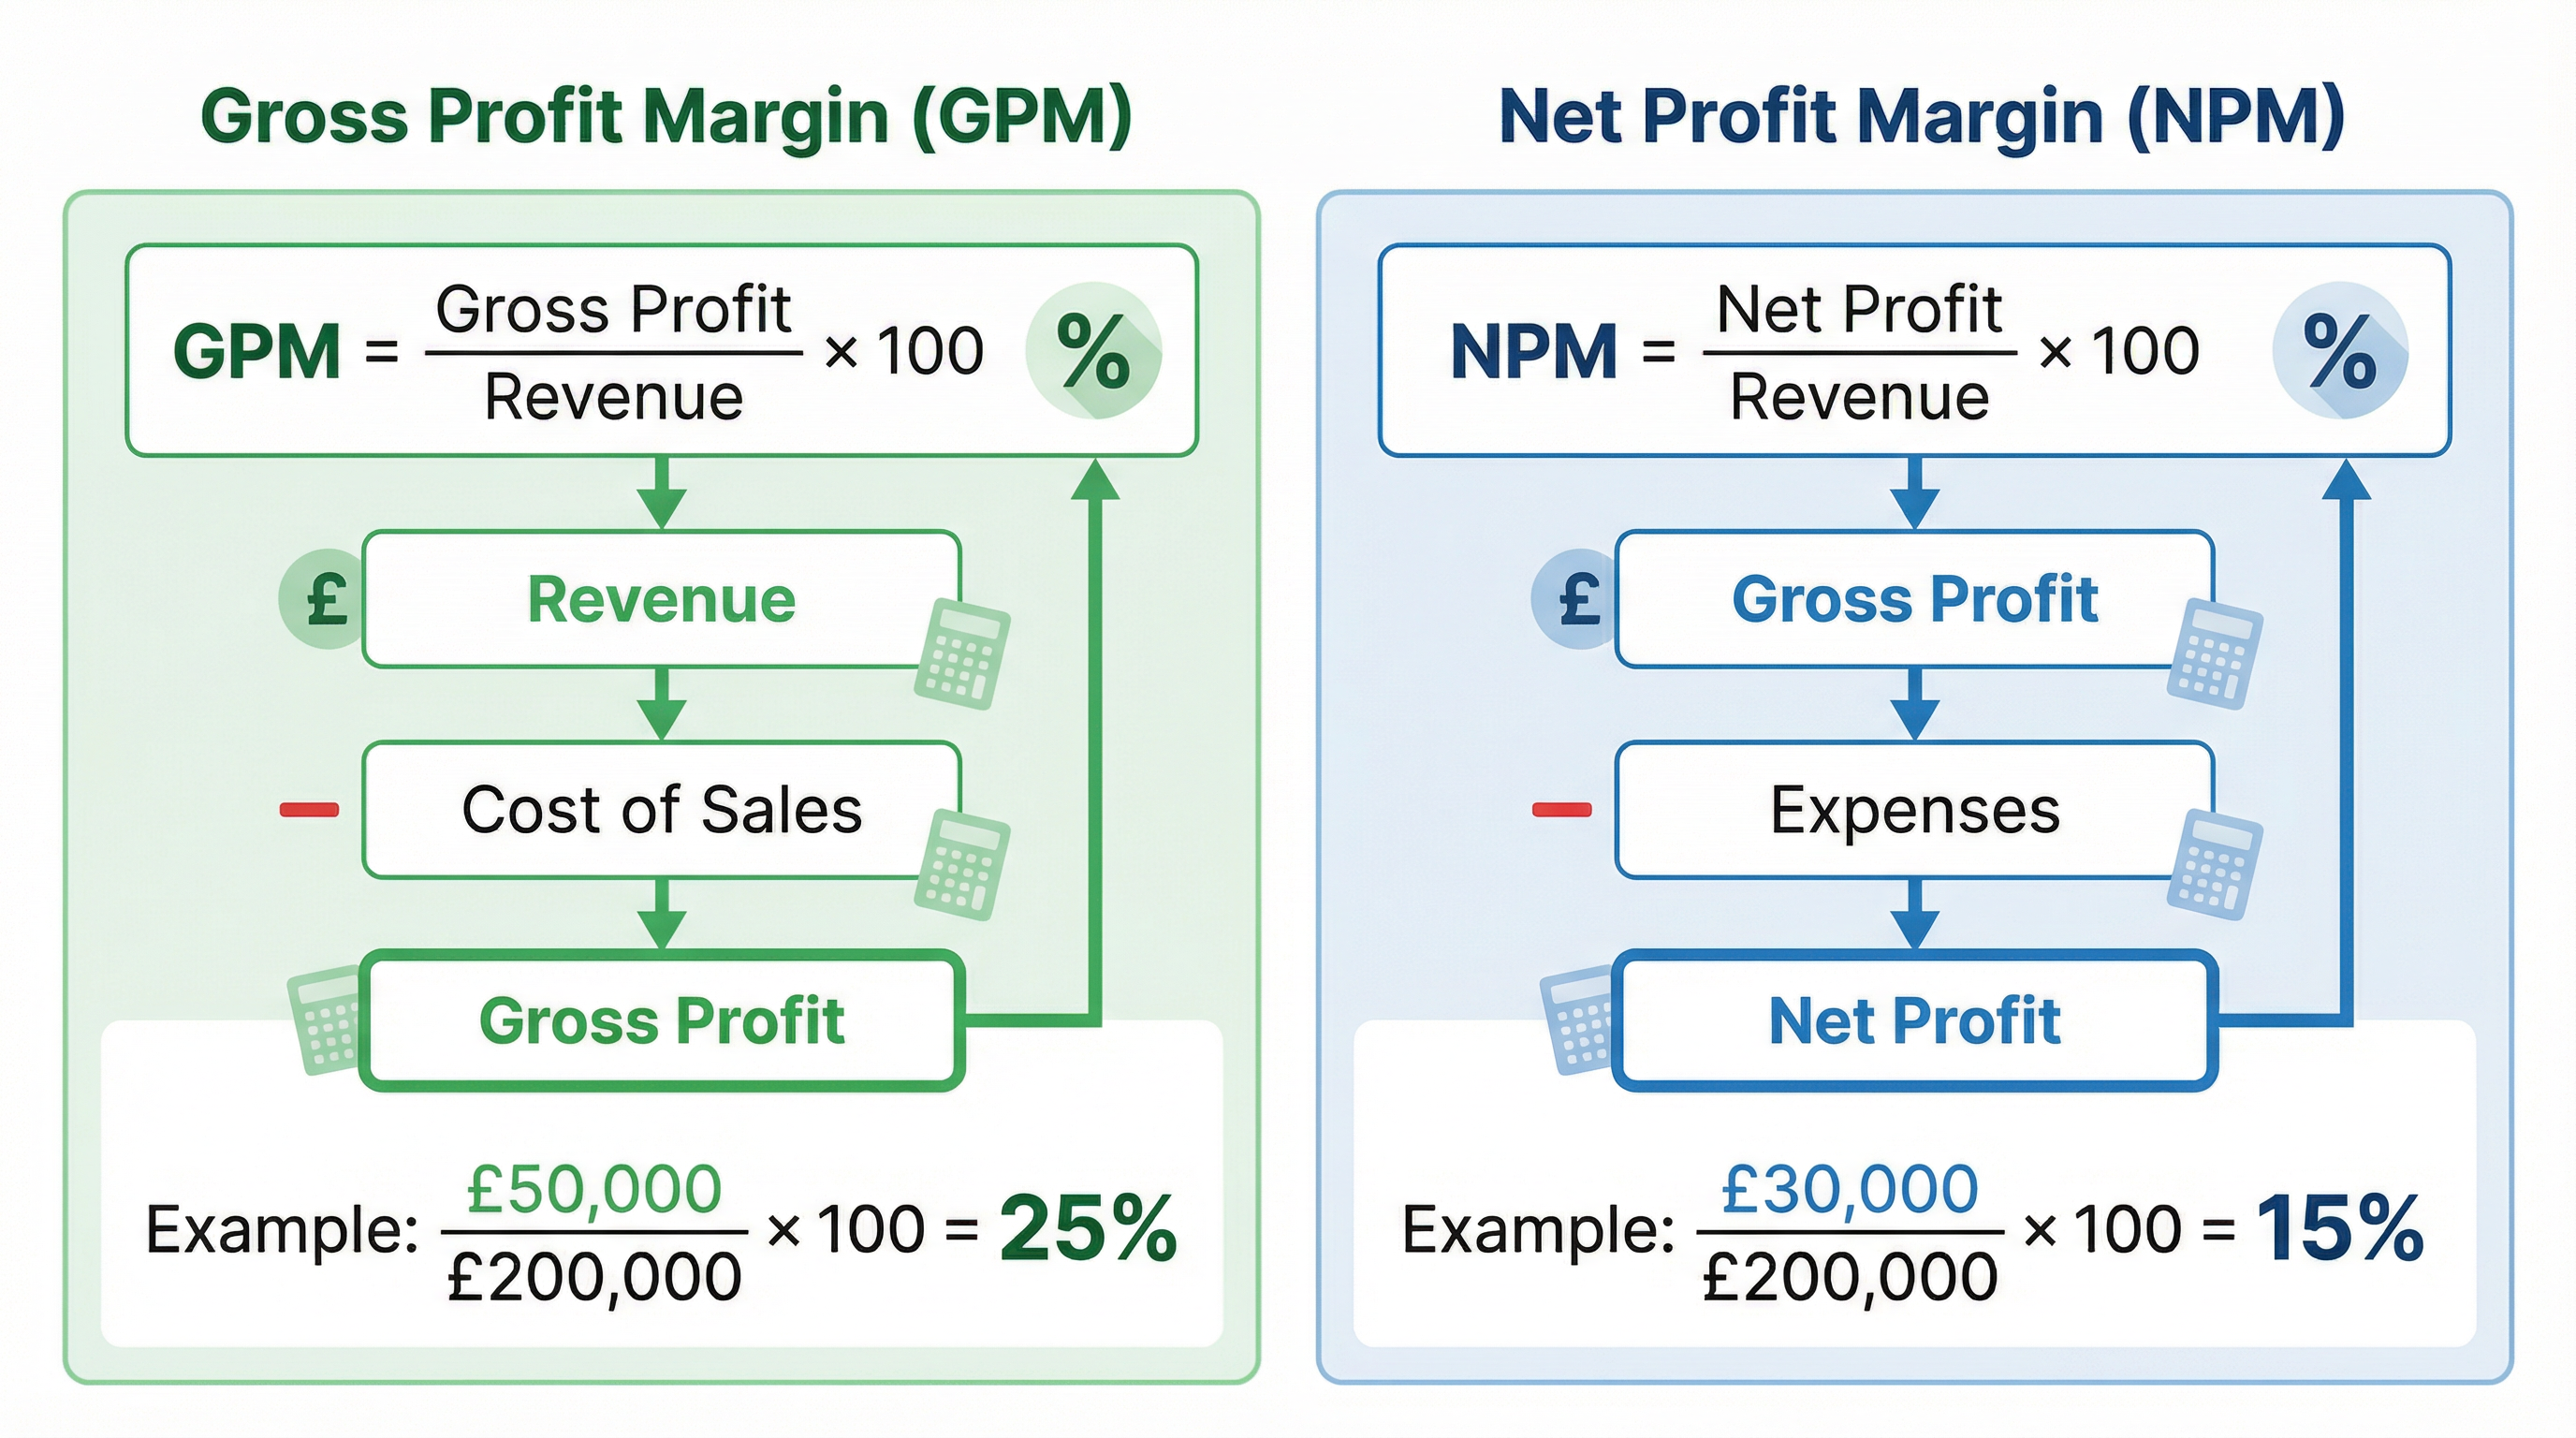
Net Profit Margin (NPM)
What it measures: NPM provides a comprehensive view of a business's overall profitability by taking into account all of its operating expenses, not just the cost of sales. This includes overheads like rent, wages, utility bills, and marketing costs.
Formula: Net Profit / Revenue x 100
Why it matters: NPM is the bottom line. It shows what percentage of revenue is left after all costs have been paid. A significant difference between GPM and NPM suggests that a business has high overheads which are eating into its profitability. Examiners often use this to test a candidate's ability to analyse expense control.
Specific Knowledge: Candidates must know the formula and be able to calculate Net Profit (Gross Profit - Expenses) if it is not provided directly.
Second-Order Concepts
Causation
Understanding why a ratio has changed is a higher-level skill. For example, a new marketing campaign (cause) could lead to higher sales but also increased expenses, potentially causing NPM to fall (effect) in the short term, even if GPM remains stable.
Consequence
A declining NPM, if sustained, can have serious consequences for a business, such as reduced ability to reinvest, difficulty in securing loans, and a lower valuation. Conversely, an improving NPM can fund expansion and innovation.
Change & Continuity
Candidates should be able to analyse ratio data over several years. A one-off dip in NPM might be explainable, but a continuous decline over three years points to a more significant underlying problem that needs to be addressed.
Significance
The significance of a particular ratio result depends on the context. A 5% NPM might be excellent for a high-volume, low-margin supermarket but would be a major concern for a low-volume, high-margin luxury car manufacturer. Comparison with industry averages and previous performance is key.