OCR · A-Level · Chemistry
Course version: H432 · Version from Sept 2017
(iii) explanation of indicator colour changes in terms of equilibrium…
Full specification wording
Acids, bases and buffers: (iii) explanation of indicator colour changes in terms of equilibrium shift between the HA and A⁻ forms of the indicator
An acid–base indicator is itself a weak acid, written HA, that dissociates in water: HA ⇌ H⁺ + A⁻.
- Point 25 of 26
- 4 key terms
Study notes
From the teaching notes for this specification point.
The idea
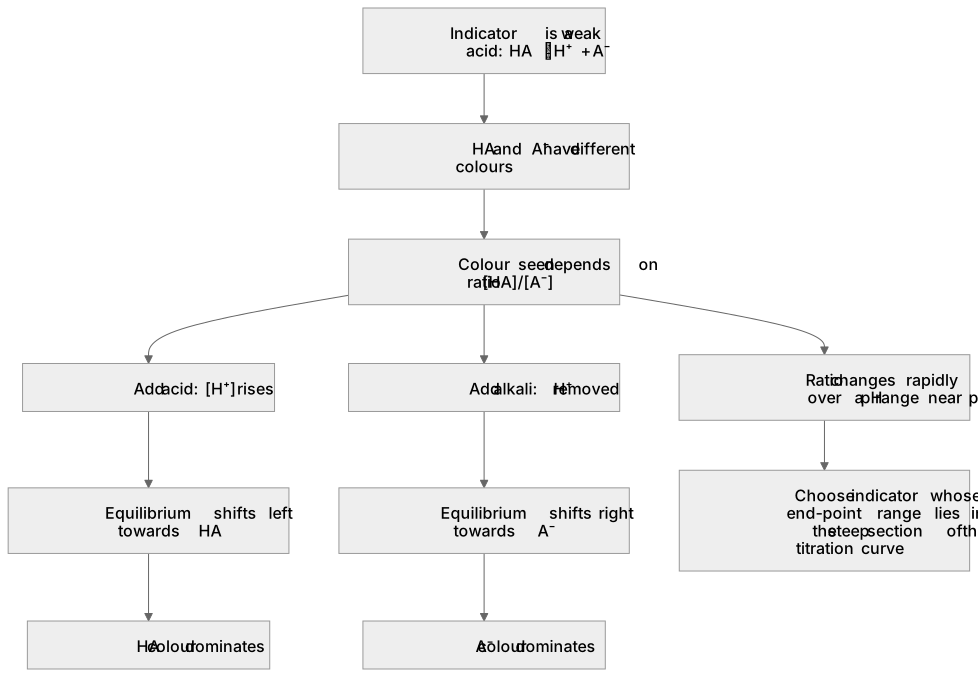
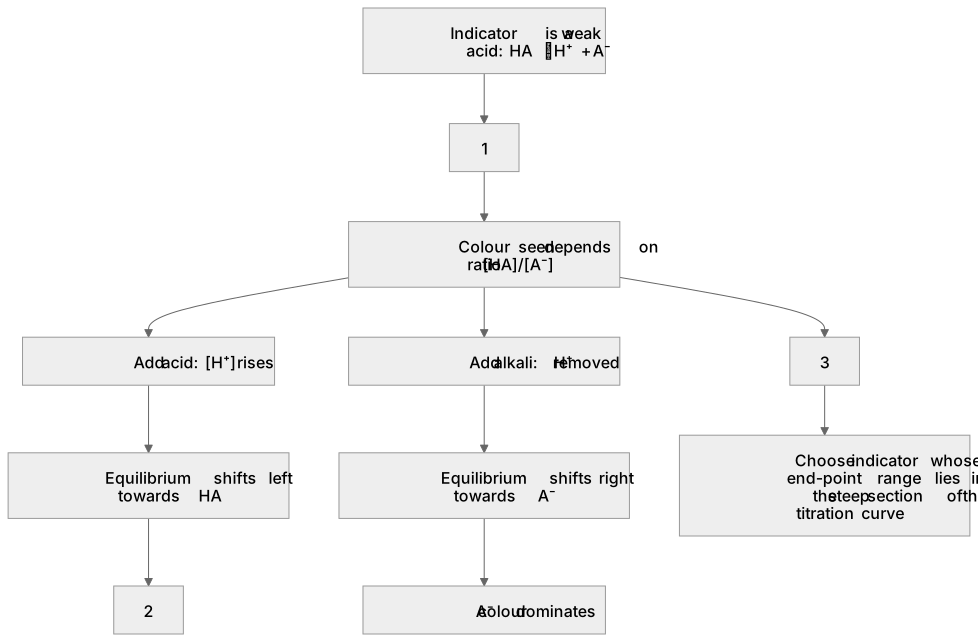
An acid–base indicator is itself a weak acid, written HA, that dissociates in water: HA ⇌ H⁺ + A⁻. The two forms have different colours, so the colour you see depends on the ratio [HA]/[A⁻]. Adding acid raises [H⁺]; by Le Chatelier's principle the position of equilibrium shifts to the left, towards HA, so the colour of the HA form dominates. Adding alkali removes H⁺ (neutralising it), so equilibrium shifts to the right, towards A⁻, and the colour of the A⁻ form dominates. The indicator changes colour over a pH range roughly centred on its pKa, because the ratio changes rapidly there. For a titration, choose an indicator whose end-point range lies within the steep section of the titration curve.
What earns the marks
- States that the indicator is a weak acid that dissociates as HA ⇌ H⁺ + A⁻, with HA and A⁻ having different colours.
- Explains that adding acid increases [H⁺], so equilibrium shifts left towards HA and the HA colour dominates.
- Explains that adding alkali removes H⁺, so equilibrium shifts right towards A⁻ and the A⁻ colour dominates.
- Links the colour change to the ratio [HA]/[A⁻] changing over a pH range near the indicator's pKa.
- Selects an indicator whose end-point pH range lies within the steep part of the titration curve.
Common mistakes and how to put them right
Treats the indicator as a strong acid that fully dissociates.
Put it right: Describe it as a weak acid with an equilibrium between HA and A⁻.
Claims the colour change happens at a single sharp pH value.
Put it right: Explain that it occurs over a range where the [HA]/[A⁻] ratio changes.
Says adding alkali shifts equilibrium left.
Put it right: State that removing H⁺ shifts equilibrium right towards A⁻.
Ignores the need to match the indicator range to the titration curve.
Put it right: Choose an indicator whose range sits on the steep section.
Exam tips
- Write the equilibrium HA ⇌ H⁺ + A⁻ first, then reason about the shift in each direction.
- Name which form (HA or A⁻) gives which colour rather than saying only 'the colour changes'.
- When choosing an indicator, refer to the steep part of the titration curve and the indicator's pH range.
Try the lesson
The start of the Acids, bases and buffers: (iii) explanation of indicator colour changes in terms of equilibrium shift between the HA and A⁻ forms of the indicator lesson, made from teaching notes for this specification point.
Listen
An acid–base indicator is itself a weak acid, written HA, that dissociates in water: HA ⇌ H⁺ + A⁻. The two forms have different colours, so the colour you see depends on the ratio [HA]/[A⁻]. Adding acid raises [H⁺]; by Le Chatelier's principle the position of equilibrium shifts to the left, towards HA, so the colour of the HA form dominates. Adding alkali removes H⁺ (neutralising it), so equilibrium shifts to the right, towards A⁻, and the colour of the A⁻ form dominates. The indicator changes colour over a pH range roughly centred on its pKa, because the ratio changes rapidly there. For a titration, choose an indicator whose end-point range lies within the steep section of the titration curve. A strong answer earns marks for these points. States that the indicator is a weak acid that dissociates as HA ⇌ H⁺ + A⁻, with HA and A⁻ having different colours. Explains that adding acid increases [H⁺], so equilibrium shifts left towards HA and the HA colour dominates. Explains that adding alkali removes H⁺, so equilibrium shifts right towards A⁻ and the A⁻ colour dominates. Links the colour change to the ratio [HA]/[A⁻] changing over a pH range near the indicator's pKa. Exam tip: Write the equilibrium HA ⇌ H⁺ + A⁻ first, then reason about the shift in each direction.
See it
Key words
Say what each word means before you turn the card.
Weak acid equilibrium of indicators
Try answering aloud or in your head before turning the card.
Le Chatelier's principle and equilibrium shift
Try answering aloud or in your head before turning the card.
Relationship between [HA]/[A⁻] ratio and colour
Try answering aloud or in your head before turning the card.
Indicator selection for titrations
Try answering aloud or in your head before turning the card.
See every definition
- Weak acid equilibrium of indicators
- An acid–base indicator is itself a weak acid, written HA, that dissociates in water as HA ⇌ H⁺ + A⁻.
- Le Chatelier's principle and equilibrium shift
- Adding acid raises [H⁺] so equilibrium shifts left towards HA, while adding alkali removes H⁺ so equilibrium shifts right towards A⁻.
- Relationship between [HA]/[A⁻] ratio and colour
- The two forms have different colours, so the colour you see depends on the ratio [HA]/[A⁻].
- Indicator selection for titrations
- Choose an indicator whose end-point range lies within the steep section of the titration curve.
Label the diagram
Some boxes have lost their names. Pick the right name for each number.
1Box 1
2Box 2
3Box 3
There is more to this lesson
The full lesson goes on to check your understanding and help you earn the marks. Create a free account to carry on, with your progress saved.
A week of Premium from your first lesson · Then the free plan continues · No card, no charge
Test your understanding of Acids, bases and buffers: (iii) explanation of indicator colour changes in terms of equilibrium shift between the HA and A⁻ forms of the indicator
Active recall beats re-reading. Take an instant quiz now to test what you’ve learned and lock it into long-term memory.
A week of Premium from your first lesson · Then the free plan continues · No card, no charge