OCR · A-Level · Chemistry
Course version: H432 · Version from Sept 2017
(i) selection and labelling of axes with appropriate scales, quantities…
Full specification wording
Analysis: (i) selection and labelling of axes with appropriate scales, quantities and units
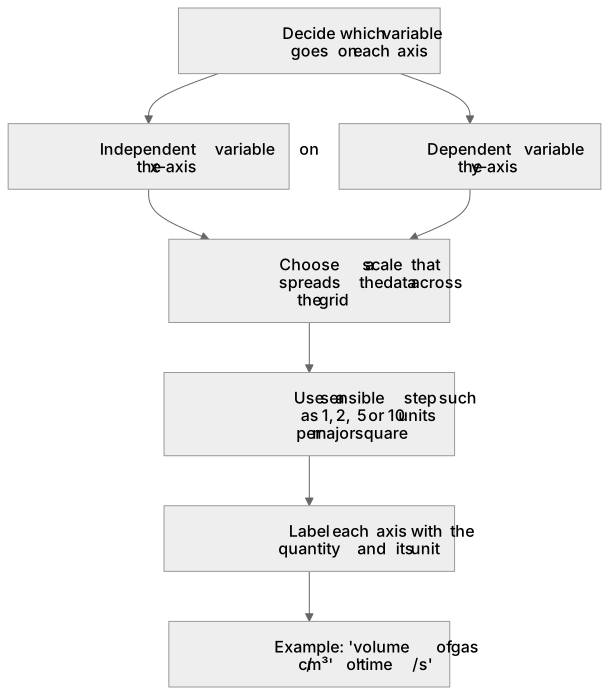
When you plot or interpret a graph from practical data, you first decide which variable goes on each axis, then choose a scale that spreads the data across the grid, then label each axis with the…
- Point 3 of 4
- 4 key terms
Study notes
From the teaching notes for this specification point.
The idea
When you plot or interpret a graph from practical data, you first decide which variable goes on each axis, then choose a scale that spreads the data across the grid, then label each axis with the quantity and its unit. Put the independent variable on the x-axis and the dependent variable on the y-axis. Choose a scale so the plotted points fill most of the graph paper, using a sensible step such as 1, 2, 5 or 10 units per major square rather than an awkward step like 3. Label each axis with the quantity name or symbol and its unit, for example 'volume of gas / cm³' or 'time / s'. A graph of titre volume against concentration, for instance, needs both axes labelled with units before any gradient is found.
What earns the marks
- Places the independent variable on the horizontal axis and the dependent variable on the vertical axis.
- Chooses a scale in convenient steps so the data spread across most of the grid.
- Labels each axis with the quantity and its unit, for example 'mass / g' or 'time / s'.
- Uses a consistent scale along each axis so equal divisions represent equal intervals.
Common mistakes and how to put them right
Swaps the independent and dependent variables between the axes.
Put it right: Keep the variable you change on the horizontal axis.
Omits units from an axis label.
Put it right: Add the unit after the quantity, as in 'temperature / K'.
Uses an awkward scale step that wastes grid space.
Put it right: Choose a step such as 1, 2, 5 or 10 per major square.
Exam tips
- Read the axis labels in a multiple-choice option before judging the scale, because a correct scale with a wrong label is still wrong.
- Check that each axis label pairs a quantity with a matching unit, such as concentration in mol dm⁻³.
- Confirm the chosen scale lets the largest and smallest data values both fit on the grid.
Try the lesson
The start of the Analysis: (i) selection and labelling of axes with appropriate scales, quantities and units lesson, made from teaching notes for this specification point.
Listen
When you plot or interpret a graph from practical data, you first decide which variable goes on each axis, then choose a scale that spreads the data across the grid, then label each axis with the quantity and its unit. Put the independent variable on the x-axis and the dependent variable on the y-axis. Choose a scale so the plotted points fill most of the graph paper, using a sensible step such as 1, 2, 5 or 10 units per major square rather than an awkward step like 3. Label each axis with the quantity name or symbol and its unit, for example 'volume of gas / cm³' or 'time / s'. A graph of titre volume against concentration, for instance, needs both axes labelled with units before any gradient is found. A strong answer earns marks for these points. Places the independent variable on the horizontal axis and the dependent variable on the vertical axis. Chooses a scale in convenient steps so the data spread across most of the grid. Labels each axis with the quantity and its unit, for example 'mass / g' or 'time / s'. Uses a consistent scale along each axis so equal divisions represent equal intervals. Exam tip: Read the axis labels in a multiple-choice option before judging the scale, because a correct scale with a wrong label is still wrong.
See it
Key words
Say what each word means before you turn the card.
Independent and dependent variables
Try answering aloud or in your head before turning the card.
Choice of scale
Try answering aloud or in your head before turning the card.
Axis labelling with quantities
Try answering aloud or in your head before turning the card.
Axis labelling with units
Try answering aloud or in your head before turning the card.
See every definition
- Independent and dependent variables
- The variable you change goes on the horizontal axis, and the dependent variable goes on the vertical axis.
- Choice of scale
- A scale is chosen in convenient steps so the data spread across most of the grid, using a sensible step such as 1, 2, 5 or 10 units per major square.
- Axis labelling with quantities
- Each axis is labelled with the quantity name or symbol, for example 'volume of gas' or 'time'.
- Axis labelling with units
- Each axis label pairs the quantity with its unit, for example 'volume of gas / cm³' or 'time / s'.
Label the diagram
Some boxes have lost their names. Pick the right name for each number.
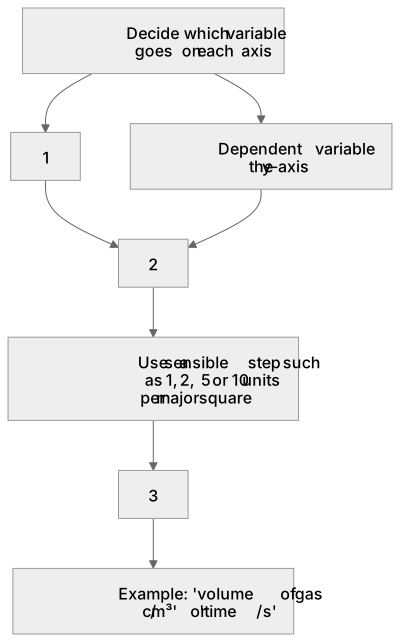
1Box 1
2Box 2
3Box 3
There is more to this lesson
The full lesson goes on to check your understanding and help you earn the marks. Create a free account to carry on, with your progress saved.
A week of Premium from your first lesson · Then the free plan continues · No card, no charge
Test your understanding of Analysis: (i) selection and labelling of axes with appropriate scales, quantities and units
Active recall beats re-reading. Take an instant quiz now to test what you’ve learned and lock it into long-term memory.
A week of Premium from your first lesson · Then the free plan continues · No card, no charge