OCR · A-Level · Chemistry
Course version: H432 · Version from Sept 2017
Analysis: (c) appropriate use of significant figures
Significant figures communicate how precisely a measured or calculated value is known.
- Point 2 of 4
- 4 key terms
Study notes
From the teaching notes for this specification point.
The idea
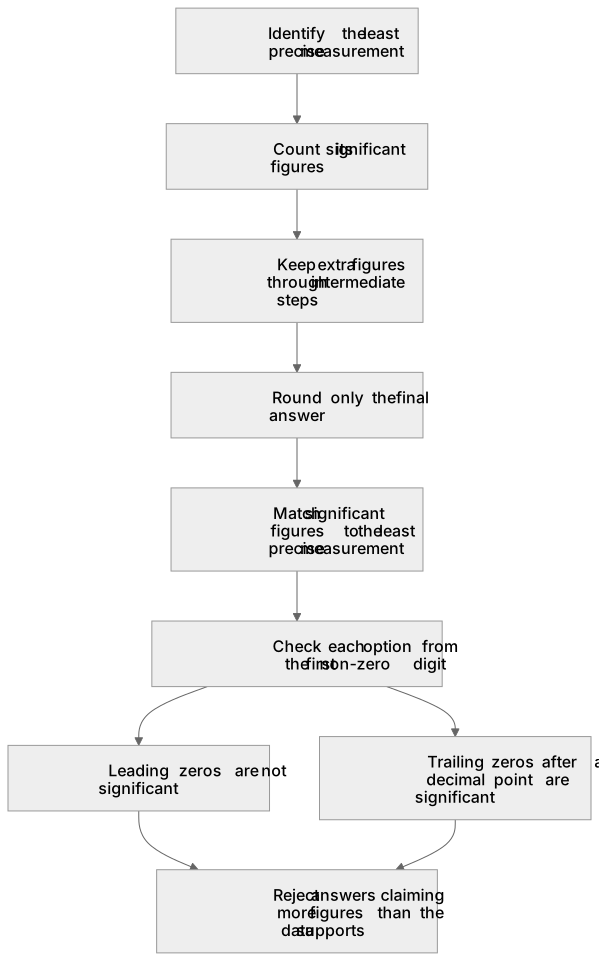
Significant figures communicate how precisely a measured or calculated value is known. In titrations, masses and gas volumes, the recorded data limit the precision of any derived result, so a final answer should not claim more figures than the input justifies. A common convention is to give a calculated result to the same number of significant figures as the least precise measurement used, and to keep extra figures through intermediate steps before rounding at the end. Leading zeros are never significant; trailing zeros after a decimal point are. For example, 0.0250 mol has three significant figures, while 250 cm³ is ambiguous unless written as 2.50 × 10² cm³. Learners choose the option that reports a value with a defensible number of significant figures for the data given.
What earns the marks
- Selects the value whose number of significant figures matches the precision of the least precise measurement in the data.
- Keeps unrounded values through intermediate steps and rounds only the final answer to the appropriate number of significant figures.
- Counts leading zeros as non-significant and trailing zeros after a decimal point as significant when judging a value.
- Rejects an answer that reports more significant figures than the recorded measurements can support.
Common mistakes and how to put them right
Rounds each intermediate step to the final number of significant figures.
Put it right: Carry extra figures through the calculation and round only at the end.
Counts leading zeros in a value such as 0.0250 as significant.
Put it right: Treat only the 2, 5 and final 0 as significant.
Reports a calculated result to many decimal places regardless of the input precision.
Put it right: Match the significant figures to the least precise measurement.
Exam tips
- Identify the least precise measurement first, then count its significant figures before choosing an answer.
- Check each option by counting significant figures from the first non-zero digit.
- Watch for trailing zeros and leading zeros, which are the usual traps in these questions.
Try the lesson
The start of the Analysis: (c) appropriate use of significant figures lesson, made from teaching notes for this specification point.
Listen
Significant figures communicate how precisely a measured or calculated value is known. In titrations, masses and gas volumes, the recorded data limit the precision of any derived result, so a final answer should not claim more figures than the input justifies. A common convention is to give a calculated result to the same number of significant figures as the least precise measurement used, and to keep extra figures through intermediate steps before rounding at the end. Leading zeros are never significant; trailing zeros after a decimal point are. For example, 0.0250 mol has three significant figures, while 250 cm³ is ambiguous unless written as 2.50 × 10² cm³. Learners choose the option that reports a value with a defensible number of significant figures for the data given. A strong answer earns marks for these points. Selects the value whose number of significant figures matches the precision of the least precise measurement in the data. Keeps unrounded values through intermediate steps and rounds only the final answer to the appropriate number of significant figures. Counts leading zeros as non-significant and trailing zeros after a decimal point as significant when judging a value. Rejects an answer that reports more significant figures than the recorded measurements can support. Exam tip: Identify the least precise measurement first, then count its significant figures before choosing an answer.
See it
Key words
Say what each word means before you turn the card.
Precision of measurement
Try answering aloud or in your head before turning the card.
Significant figure counting rules
Try answering aloud or in your head before turning the card.
Rounding at the end of a calculation
Try answering aloud or in your head before turning the card.
Reporting derived results
Try answering aloud or in your head before turning the card.
See every definition
- Precision of measurement
- Significant figures communicate how precisely a measured or calculated value is known, and recorded data limit the precision of any derived result.
- Significant figure counting rules
- Leading zeros are never significant, while trailing zeros after a decimal point are significant.
- Rounding at the end of a calculation
- Extra figures are kept through intermediate steps before rounding at the end.
- Reporting derived results
- A calculated result is given to the same number of significant figures as the least precise measurement used, so a final answer should not claim more figures than the input justifies.
Label the diagram
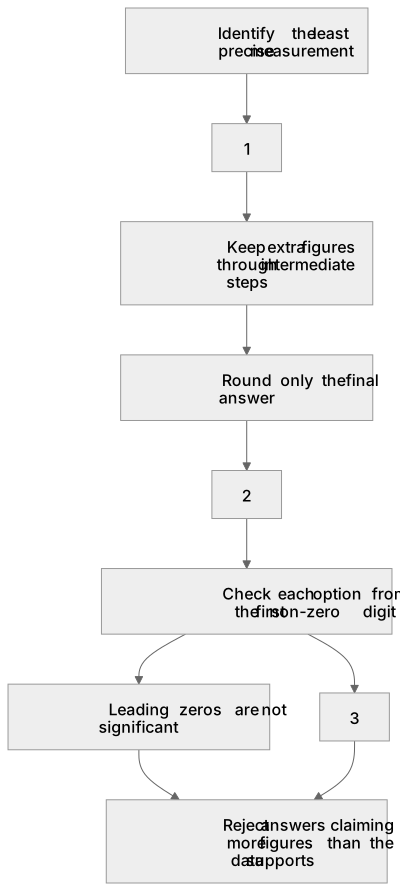
Some boxes have lost their names. Pick the right name for each number.
1Box 1
2Box 2
3Box 3
There is more to this lesson
The full lesson goes on to check your understanding and help you earn the marks. Create a free account to carry on, with your progress saved.
A week of Premium from your first lesson · Then the free plan continues · No card, no charge
Test your understanding of Analysis: (c) appropriate use of significant figures
Active recall beats re-reading. Take an instant quiz now to test what you’ve learned and lock it into long-term memory.
A week of Premium from your first lesson · Then the free plan continues · No card, no charge