OCR · A-Level · Chemistry
Course version: H432 · Version from Sept 2017
Analytical techniques: (iii) IR spectra.
An infrared spectrum plots percentage transmittance against wavenumber (cm⁻¹).
- Point 13 of 13
- 4 key terms
Study notes
From the teaching notes for this specification point.
The idea
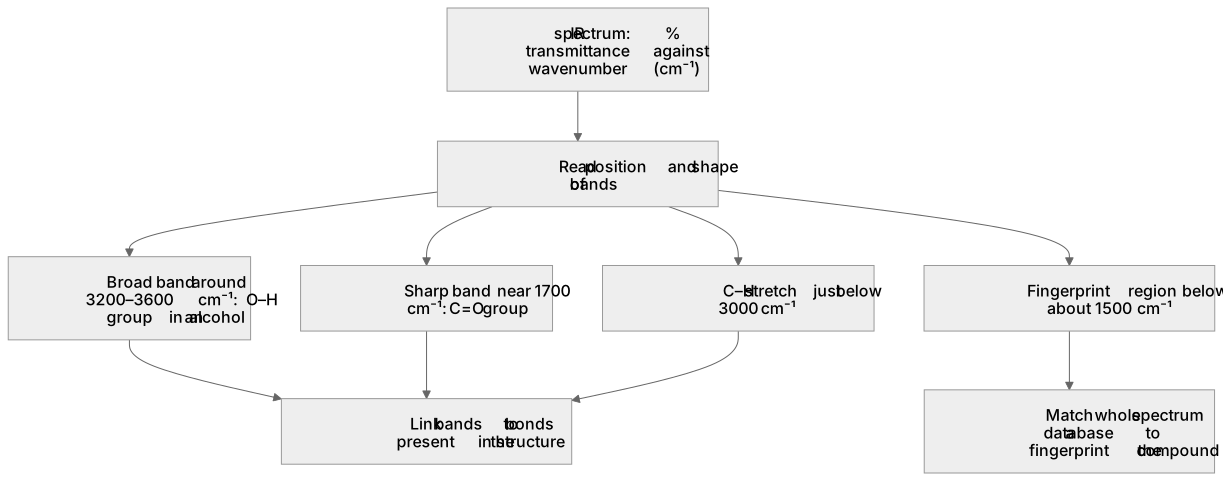
An infrared spectrum plots percentage transmittance against wavenumber (cm⁻¹). You use it to identify functional groups from absorption bands and to fingerprint a compound by matching its whole spectrum to a database. A broad absorption around 3200–3600 cm⁻¹ indicates an O–H group in an alcohol; a sharp band near 1700 cm⁻¹ indicates a C=O group; a C–H stretch appears just below 3000 cm⁻¹. The fingerprint region below about 1500 cm⁻¹ is complex and is used for matching rather than for assigning individual bonds. You read the position and shape of bands, then link them to bonds present in the structure.
What earns the marks
- Reads the wavenumber of an absorption band and assigns it to a specific bond such as O–H or C=O.
- Uses the shape of a band, for example a broad O–H absorption, to distinguish functional groups.
- Explains that the fingerprint region is used to match a spectrum to a known compound rather than to assign single bonds.
- Links the presence or absence of characteristic bands to the functional groups in a proposed structure.
Common mistakes and how to put them right
Assigns every band in the fingerprint region to a named bond.
Put it right: Use the fingerprint region for whole-spectrum matching and assign only the characteristic high-wavenumber bands.
Confuses a broad O–H absorption with a sharp C–H stretch.
Put it right: Note the width and position of the band before assigning it.
Reads wavenumber values from the transmittance axis.
Put it right: Read wavenumbers from the horizontal axis in cm⁻¹.
Exam tips
- Quote the wavenumber range of a band before naming the bond responsible.
- State whether a band is broad or sharp, since shape helps identify the group.
- Use the fingerprint region to confirm identity by comparison, not to assign individual bonds.
Try the lesson
The start of the Analytical techniques: (iii) IR spectra. lesson, made from teaching notes for this specification point.
Listen
An infrared spectrum plots percentage transmittance against wavenumber (cm⁻¹). You use it to identify functional groups from absorption bands and to fingerprint a compound by matching its whole spectrum to a database. A broad absorption around 3200–3600 cm⁻¹ indicates an O–H group in an alcohol; a sharp band near 1700 cm⁻¹ indicates a C=O group; a C–H stretch appears just below 3000 cm⁻¹. The fingerprint region below about 1500 cm⁻¹ is complex and is used for matching rather than for assigning individual bonds. You read the position and shape of bands, then link them to bonds present in the structure. A strong answer earns marks for these points. Reads the wavenumber of an absorption band and assigns it to a specific bond such as O–H or C=O. Uses the shape of a band, for example a broad O–H absorption, to distinguish functional groups. Explains that the fingerprint region is used to match a spectrum to a known compound rather than to assign single bonds. Links the presence or absence of characteristic bands to the functional groups in a proposed structure. Exam tip: Quote the wavenumber range of a band before naming the bond responsible.
See it
Key words
Say what each word means before you turn the card.
characteristic absorption bands
Try answering aloud or in your head before turning the card.
wavenumber and transmittance axes
Try answering aloud or in your head before turning the card.
functional group identification
Try answering aloud or in your head before turning the card.
fingerprint region and database matching
Try answering aloud or in your head before turning the card.
See every definition
- characteristic absorption bands
- Bands in an infrared spectrum whose position and shape are read and then linked to bonds present in the structure, such as O–H or C=O.
- wavenumber and transmittance axes
- An infrared spectrum plots percentage transmittance against wavenumber in cm⁻¹, with wavenumbers read from the horizontal axis.
- functional group identification
- Using the position and shape of absorption bands to distinguish functional groups, for example a broad absorption around 3200–3600 cm⁻¹ indicating an O–H group in an alcohol.
- fingerprint region and database matching
- The complex region below about 1500 cm⁻¹, used for matching a whole spectrum to a database rather than for assigning individual bonds.
Label the diagram
Some boxes have lost their names. Pick the right name for each number.
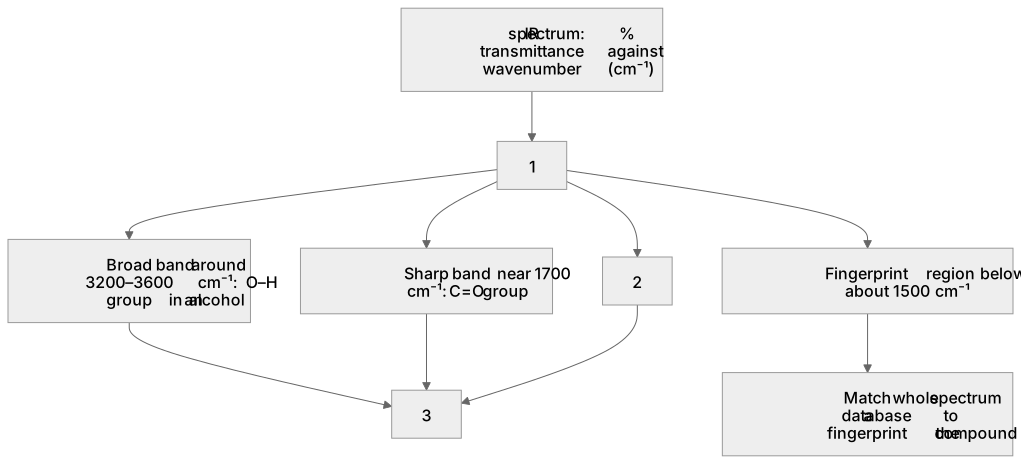
1Box 1
2Box 2
3Box 3
There is more to this lesson
The full lesson goes on to check your understanding and help you earn the marks. Create a free account to carry on, with your progress saved.
A week of Premium from your first lesson · Then the free plan continues · No card, no charge
Test your understanding of Analytical techniques: (iii) IR spectra.
Active recall beats re-reading. Take an instant quiz now to test what you’ve learned and lock it into long-term memory.
A week of Premium from your first lesson · Then the free plan continues · No card, no charge