OCR · A-Level · Chemistry
Course version: H432 · Version from Sept 2017
Analytical techniques: (ii) mass spectra
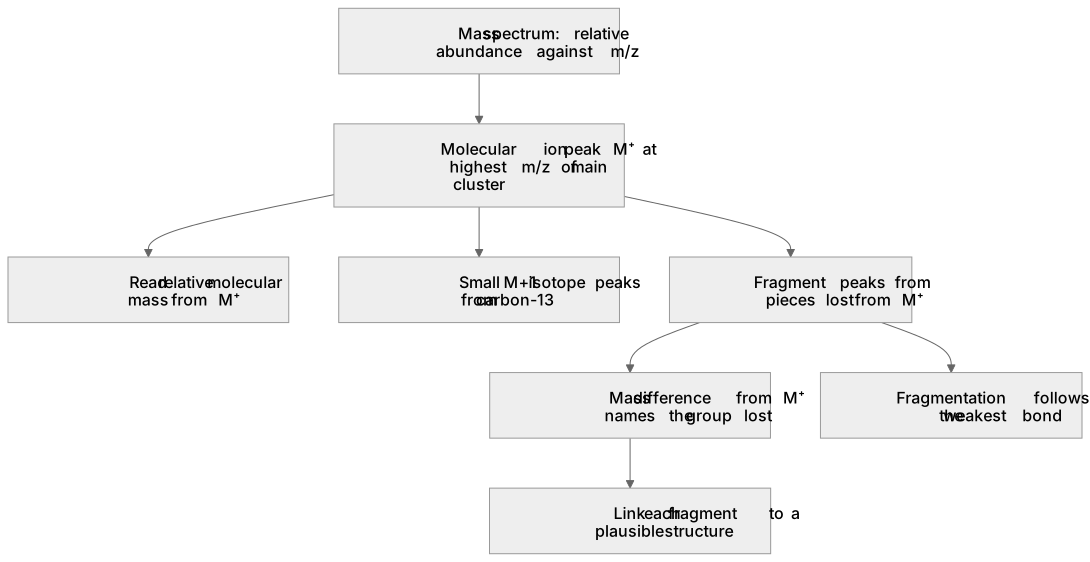
A mass spectrum plots relative abundance against m/z (mass-to-charge ratio).
- Point 12 of 13
- 4 key terms
Study notes
From the teaching notes for this specification point.
The idea
A mass spectrum plots relative abundance against m/z (mass-to-charge ratio). In the OCR A Level course you use it to find the molecular mass from the molecular ion peak, M⁺, and to infer fragments from other peaks. For example, ethanol gives a molecular ion at m/z = 46 and a prominent fragment at m/z = 31 from loss of CH₃, plus m/z = 45 from loss of a hydrogen atom. The M⁺ peak sits at the highest m/z of the main cluster (ignoring small M+1 isotope peaks). Fragmentation follows the weakest bond, so the spectrum reveals structural pieces. You interpret peaks, not calculate them from first principles, and you link each fragment to a plausible structure.
What earns the marks
- Identifies the molecular ion peak as the highest m/z value in the main cluster and reads the relative molecular mass from it.
- Explains that a fragment peak arises from loss of a specific group, giving the mass difference from M⁺.
- Uses m/z values to deduce a plausible structural fragment consistent with the molecular formula.
- Distinguishes the molecular ion peak from small M+1 isotope peaks caused by carbon-13.
Common mistakes and how to put them right
Reads the tallest peak as the molecular ion.
Put it right: Identify the molecular ion from its position at the highest m/z of the main cluster, not from its height.
Treats every peak as a separate molecule.
Put it right: Explain fragment peaks as pieces lost from the molecular ion.
Ignores the M+1 peak and misreads the molecular mass.
Put it right: Use the main M⁺ peak and treat the small peak one unit higher as an isotope contribution.
Exam tips
- State the m/z of the molecular ion explicitly before deducing the molecular mass.
- Calculate the mass difference between M⁺ and a fragment peak to name the group lost.
- Check the molecular formula against your proposed fragment so the pieces add up.
Try the lesson
The start of the Analytical techniques: (ii) mass spectra lesson, made from teaching notes for this specification point.
Listen
A mass spectrum plots relative abundance against m/z (mass-to-charge ratio). In the OCR A Level course you use it to find the molecular mass from the molecular ion peak, M⁺, and to infer fragments from other peaks. For example, ethanol gives a molecular ion at m/z = 46 and a prominent fragment at m/z = 31 from loss of CH₃, plus m/z = 45 from loss of a hydrogen atom. The M⁺ peak sits at the highest m/z of the main cluster (ignoring small M+1 isotope peaks). Fragmentation follows the weakest bond, so the spectrum reveals structural pieces. You interpret peaks, not calculate them from first principles, and you link each fragment to a plausible structure. A strong answer earns marks for these points. Identifies the molecular ion peak as the highest m/z value in the main cluster and reads the relative molecular mass from it. Explains that a fragment peak arises from loss of a specific group, giving the mass difference from M⁺. Uses m/z values to deduce a plausible structural fragment consistent with the molecular formula. Distinguishes the molecular ion peak from small M+1 isotope peaks caused by carbon-13. Exam tip: State the m/z of the molecular ion explicitly before deducing the molecular mass.
See it
Key words
Say what each word means before you turn the card.
molecular ion and molecular mass
Try answering aloud or in your head before turning the card.
fragmentation and bond breaking
Try answering aloud or in your head before turning the card.
m/z scale and relative abundance
Try answering aloud or in your head before turning the card.
isotope peaks and structure deduction
Try answering aloud or in your head before turning the card.
See every definition
- molecular ion and molecular mass
- The molecular ion peak sits at the highest m/z of the main cluster, and the relative molecular mass is read from it.
- fragmentation and bond breaking
- Fragmentation follows the weakest bond, so the spectrum reveals structural pieces as pieces lost from the molecular ion.
- m/z scale and relative abundance
- A mass spectrum plots relative abundance against m/z, the mass-to-charge ratio.
- isotope peaks and structure deduction
- Small M+1 isotope peaks caused by carbon-13 are distinguished from the molecular ion peak, and m/z values are used to deduce a plausible structural fragment.
Label the diagram
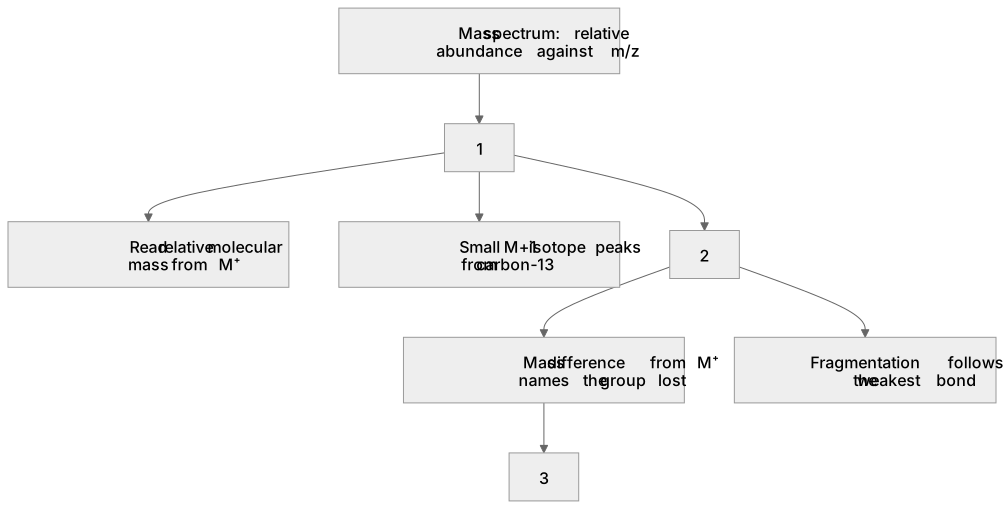
Some boxes have lost their names. Pick the right name for each number.
1Box 1
2Box 2
3Box 3
There is more to this lesson
The full lesson goes on to check your understanding and help you earn the marks. Create a free account to carry on, with your progress saved.
A week of Premium from your first lesson · Then the free plan continues · No card, no charge
Test your understanding of Analytical techniques: (ii) mass spectra
Active recall beats re-reading. Take an instant quiz now to test what you’ve learned and lock it into long-term memory.
A week of Premium from your first lesson · Then the free plan continues · No card, no charge