OCR · A-Level · Chemistry
Course version: H432 · Version from Sept 2017
(ii) the amounts and proportions of the components in a mixture.
Full specification wording
Chromatography and qualitative analysis: (ii) the amounts and proportions of the components in a mixture.
Chromatography separates the components of a mixture between a mobile phase and a stationary phase.
- Point 5 of 14
- 4 key terms
Study notes
From the teaching notes for this specification point.
The idea
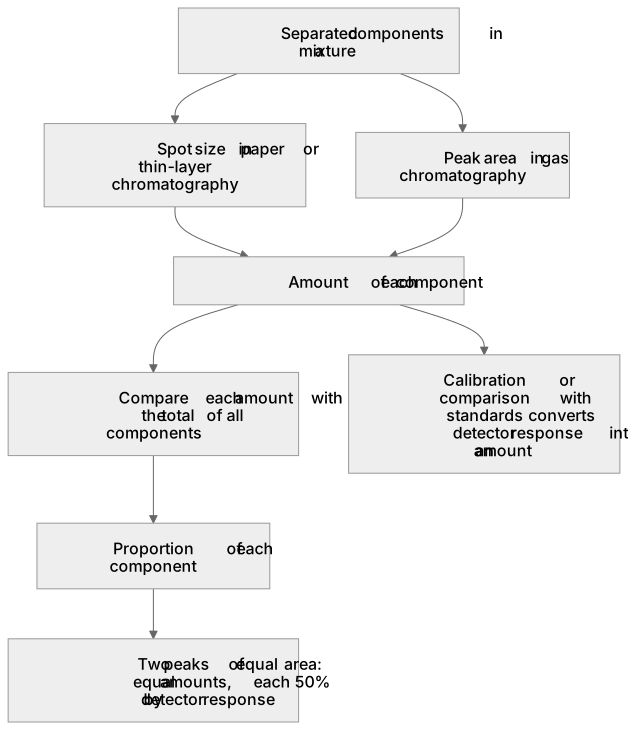
Chromatography separates the components of a mixture between a mobile phase and a stationary phase. The amount of each component present controls how large a signal it gives, while the proportion describes its share of the whole mixture. In paper or thin-layer chromatography the separated spots can be located and their sizes compared; in gas chromatography the detector response produces a peak whose area is proportional to the amount of that component. Comparing peak areas or spot sizes therefore gives the amounts, and expressing each as a fraction of the total gives the proportions. A mixture giving two peaks of equal area contains equal amounts of the two components, so each is 50% by the detector's response.
What earns the marks
- States that the amount of a component is indicated by the size of its spot or the area of its chromatographic peak.
- Explains that proportions are found by comparing each component's amount with the total of all components.
- Recognises that a component giving half the total peak area makes up 50% of the mixture by that measure.
- Describes how a calibration or comparison with standards can convert a detector response into an amount.
Common mistakes and how to put them right
Confuses the Rf value with the amount of a component.
Put it right: Keep Rf as an identification measure and use spot size or peak area for amount.
Assumes equal peak heights always mean equal amounts.
Put it right: Check peak area, since width also contributes.
Treats proportions as absolute masses without calibration.
Put it right: Describe the response as proportional to amount unless standards are used.
Exam tips
- Read the question carefully to see whether it asks for amount, proportion or both, and answer each part separately.
- Use the phrase 'proportional to' when linking peak area or spot size to amount.
- Show any proportion calculation as a fraction of the total, for example dividing one peak area by the sum of all peak areas.
Try the lesson
The start of the Chromatography and qualitative analysis: (ii) the amounts and proportions of the components in a mixture. lesson, made from teaching notes for this specification point.
Listen
Chromatography separates the components of a mixture between a mobile phase and a stationary phase. The amount of each component present controls how large a signal it gives, while the proportion describes its share of the whole mixture. In paper or thin-layer chromatography the separated spots can be located and their sizes compared; in gas chromatography the detector response produces a peak whose area is proportional to the amount of that component. Comparing peak areas or spot sizes therefore gives the amounts, and expressing each as a fraction of the total gives the proportions. A mixture giving two peaks of equal area contains equal amounts of the two components, so each is 50% by the detector's response. A strong answer earns marks for these points. States that the amount of a component is indicated by the size of its spot or the area of its chromatographic peak. Explains that proportions are found by comparing each component's amount with the total of all components. Recognises that a component giving half the total peak area makes up 50% of the mixture by that measure. Describes how a calibration or comparison with standards can convert a detector response into an amount. Exam tip: Read the question carefully to see whether it asks for amount, proportion or both, and answer each part separately.
See it
Key words
Say what each word means before you turn the card.
Mobile and stationary phases
Try answering aloud or in your head before turning the card.
Peak area and spot size as measures of amount
Try answering aloud or in your head before turning the card.
Proportions as fractions of the total
Try answering aloud or in your head before turning the card.
Calibration against standards
Try answering aloud or in your head before turning the card.
See every definition
- Mobile and stationary phases
- Chromatography separates the components of a mixture between a mobile phase and a stationary phase.
- Peak area and spot size as measures of amount
- The amount of each component present controls how large a signal it gives, shown by the size of its spot or the area of its chromatographic peak.
- Proportions as fractions of the total
- Expressing each component's amount as a fraction of the total gives the proportions, found by comparing each component's amount with the total of all components.
- Calibration against standards
- A calibration or comparison with standards can convert a detector response into an amount.
Label the diagram
Some boxes have lost their names. Pick the right name for each number.
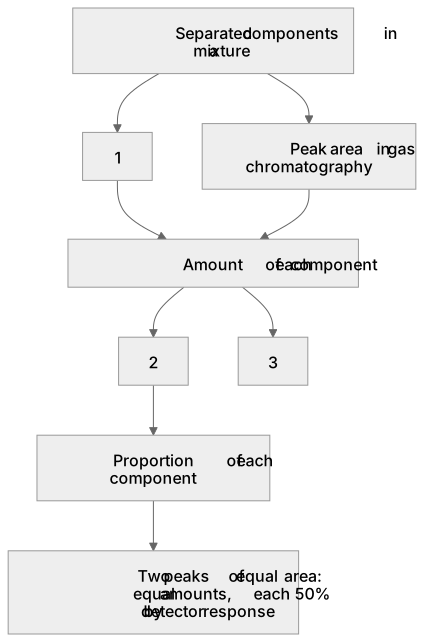
1Box 1
2Box 2
3Box 3
There is more to this lesson
The full lesson goes on to check your understanding and help you earn the marks. Create a free account to carry on, with your progress saved.
A week of Premium from your first lesson · Then the free plan continues · No card, no charge
Test your understanding of Chromatography and qualitative analysis: (ii) the amounts and proportions of the components in a mixture.
Active recall beats re-reading. Take an instant quiz now to test what you’ve learned and lock it into long-term memory.
A week of Premium from your first lesson · Then the free plan continues · No card, no charge