OCR · A-Level · Chemistry
Course version: H432 · Version from Sept 2017
(c) qualitative explanation of the term activation energy, including use…
Full specification wording
Enthalpy changes: (c) qualitative explanation of the term activation energy, including use of enthalpy profile diagrams
Activation energy is the minimum energy that colliding particles must possess for a reaction to occur.
- Point 4 of 20
- 4 key terms
Study notes
From the teaching notes for this specification point.
The idea
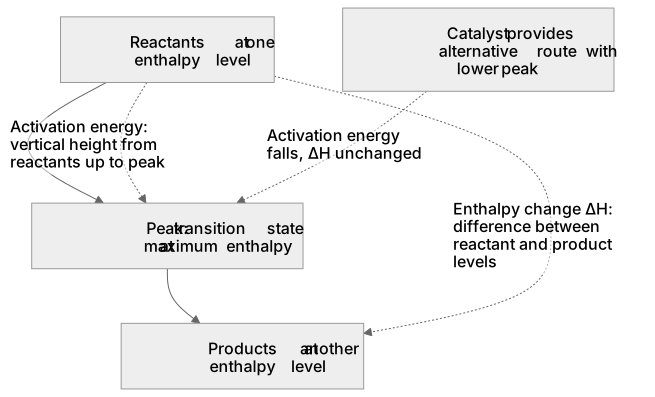
Activation energy is the minimum energy that colliding particles must possess for a reaction to occur. On an enthalpy profile diagram the vertical axis shows enthalpy and the horizontal axis shows the reaction pathway from reactants to products. The reactants sit at one enthalpy level and the products at another; the difference between them is the enthalpy change ΔH. Between them lies a peak representing the transition state at the maximum enthalpy along the route. The activation energy is the vertical height from the reactants' enthalpy level up to that peak. A large activation energy means few collisions have enough energy, so the reaction is slow at a given temperature. Catalysts provide an alternative route with a lower peak, so the activation energy falls.
What earns the marks
- Defines activation energy as the minimum energy that colliding particles need in order to react.
- Identifies the peak of an enthalpy profile diagram as the transition state at maximum enthalpy.
- Measures activation energy as the vertical distance from the reactants' enthalpy level to the peak.
- Distinguishes the enthalpy change ΔH as the difference between reactants' and products' enthalpy levels.
- Explains that a catalyst lowers the peak and so reduces the activation energy without changing ΔH.
Common mistakes and how to put them right
Confuses activation energy with the enthalpy change ΔH.
Put it right: Measure activation energy from the reactants' level to the peak, not from reactants to products.
Reads activation energy from the products' level to the peak.
Put it right: Measure it from the reactants' level upwards.
Treats a catalyst as changing the enthalpy change.
Put it right: State that a catalyst lowers the activation energy only.
Exam tips
- Sketch the profile with labelled axes before choosing an answer, so the vertical distances are clear.
- Check whether a question asks for activation energy or enthalpy change; they are different vertical distances.
- Remember a catalyst lowers the peak but leaves the reactant and product levels unchanged.
Try the lesson
The start of the Enthalpy changes: (c) qualitative explanation of the term activation energy, including use of enthalpy profile diagrams lesson, made from teaching notes for this specification point.
Listen
Activation energy is the minimum energy that colliding particles must possess for a reaction to occur. On an enthalpy profile diagram the vertical axis shows enthalpy and the horizontal axis shows the reaction pathway from reactants to products. The reactants sit at one enthalpy level and the products at another; the difference between them is the enthalpy change ΔH. Between them lies a peak representing the transition state at the maximum enthalpy along the route. The activation energy is the vertical height from the reactants' enthalpy level up to that peak. A large activation energy means few collisions have enough energy, so the reaction is slow at a given temperature. Catalysts provide an alternative route with a lower peak, so the activation energy falls. A strong answer earns marks for these points. Defines activation energy as the minimum energy that colliding particles need in order to react. Identifies the peak of an enthalpy profile diagram as the transition state at maximum enthalpy. Measures activation energy as the vertical distance from the reactants' enthalpy level to the peak. Distinguishes the enthalpy change ΔH as the difference between reactants' and products' enthalpy levels. Exam tip: Sketch the profile with labelled axes before choosing an answer, so the vertical distances are clear.
See it
Key words
Say what each word means before you turn the card.
Activation energy
Try answering aloud or in your head before turning the card.
Enthalpy profile diagram
Try answering aloud or in your head before turning the card.
Transition state
Try answering aloud or in your head before turning the card.
Effect of catalysts on activation energy
Try answering aloud or in your head before turning the card.
See every definition
- Activation energy
- The minimum energy that colliding particles must possess for a reaction to occur.
- Enthalpy profile diagram
- A diagram whose vertical axis shows enthalpy and whose horizontal axis shows the reaction pathway from reactants to products.
- Transition state
- The peak on an enthalpy profile diagram, representing the state at the maximum enthalpy along the route.
- Effect of catalysts on activation energy
- Catalysts provide an alternative route with a lower peak, so the activation energy falls.
Label the diagram
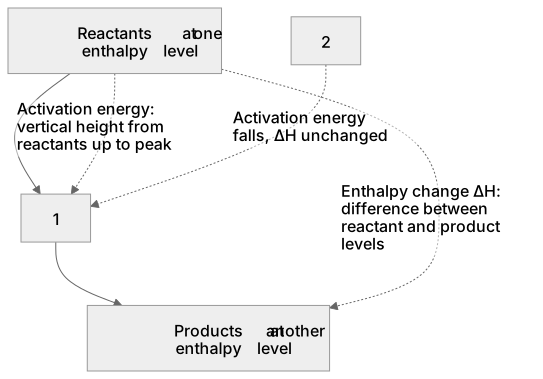
Some boxes have lost their names. Pick the right name for each number.
1Box 1
2Box 2
There is more to this lesson
The full lesson goes on to check your understanding and help you earn the marks. Create a free account to carry on, with your progress saved.
A week of Premium from your first lesson · Then the free plan continues · No card, no charge
Test your understanding of Enthalpy changes: (c) qualitative explanation of the term activation energy, including use of enthalpy profile diagrams
Active recall beats re-reading. Take an instant quiz now to test what you’ve learned and lock it into long-term memory.
A week of Premium from your first lesson · Then the free plan continues · No card, no charge