OCR · A-Level · Chemistry
Course version: H432 · Version from Sept 2017
Evaluation: (b) the identification of anomalies in experimental measurements
An anomaly is a measurement that does not fit the pattern set by the other readings, so identifying one means comparing each result with its neighbours and with the expected trend rather than…
- Point 1 of 3
- 4 key terms
Study notes
From the teaching notes for this specification point.
The idea
An anomaly is a measurement that does not fit the pattern set by the other readings, so identifying one means comparing each result with its neighbours and with the expected trend rather than judging it in isolation. In a titration, repeat titres that agree closely are treated as concordant, and a titre that lies well away from that cluster is flagged as anomalous and excluded from the mean. In a rate experiment, a gas volume that rises steadily then jumps or falls back breaks the trend and signals a procedural error such as a leak or a timing slip. The skill is to spot the outlier, justify the exclusion by reference to the surrounding data, and recompute the mean from the remaining values.
What earns the marks
- Identifies the reading that departs from the trend set by the other measurements.
- Compares each result with neighbouring values rather than judging it alone.
- Excludes the anomalous value before calculating a mean from the remaining concordant results.
- Justifies the exclusion by citing the size of the deviation from the cluster.
Common mistakes and how to put them right
Treats every slightly different repeat as anomalous.
Put it right: Keep values that agree closely and exclude only clear outliers.
Averages all readings including the outlier.
Put it right: Recalculate the mean after removing the anomalous value.
Assumes the first titre is always anomalous.
Put it right: Judge each value against the trend, not its position.
Exam tips
- State the anomalous value explicitly and quote the surrounding readings that establish the trend.
- Explain why the value is excluded before showing the recalculated mean.
- Check that the remaining values are mutually consistent before averaging them.
Try the lesson
The start of the Evaluation: (b) the identification of anomalies in experimental measurements lesson, made from teaching notes for this specification point.
Listen
An anomaly is a measurement that does not fit the pattern set by the other readings, so identifying one means comparing each result with its neighbours and with the expected trend rather than judging it in isolation. In a titration, repeat titres that agree closely are treated as concordant, and a titre that lies well away from that cluster is flagged as anomalous and excluded from the mean. In a rate experiment, a gas volume that rises steadily then jumps or falls back breaks the trend and signals a procedural error such as a leak or a timing slip. The skill is to spot the outlier, justify the exclusion by reference to the surrounding data, and recompute the mean from the remaining values. A strong answer earns marks for these points. Identifies the reading that departs from the trend set by the other measurements. Compares each result with neighbouring values rather than judging it alone. Excludes the anomalous value before calculating a mean from the remaining concordant results. Justifies the exclusion by citing the size of the deviation from the cluster. Exam tip: State the anomalous value explicitly and quote the surrounding readings that establish the trend.
See it
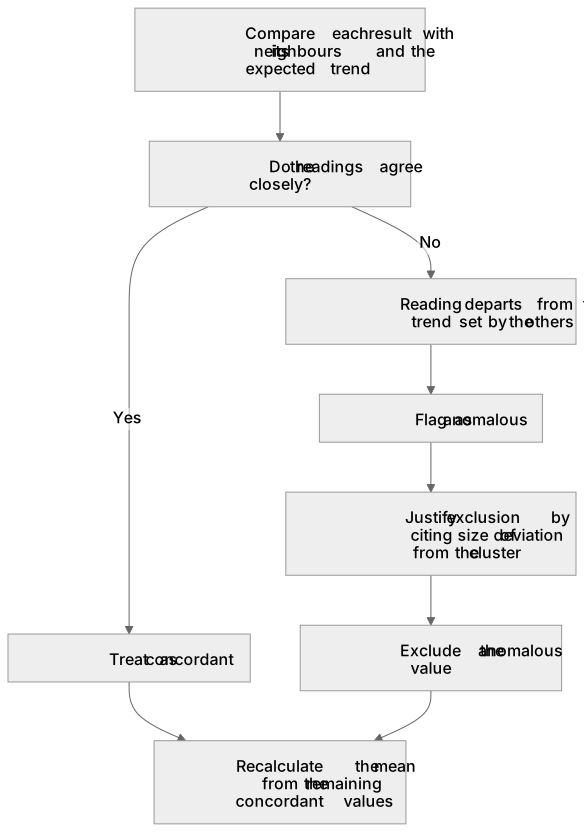
Key words
Say what each word means before you turn the card.
Anomaly
Try answering aloud or in your head before turning the card.
Concordant
Try answering aloud or in your head before turning the card.
Justifying exclusion
Try answering aloud or in your head before turning the card.
Recalculating the mean
Try answering aloud or in your head before turning the card.
See every definition
- Anomaly
- A measurement that does not fit the pattern set by the other readings, identified by comparing each result with its neighbours and with the expected trend rather than judging it in isolation.
- Concordant
- Repeat titres that agree closely are treated as concordant, while a titre lying well away from that cluster is flagged as anomalous and excluded from the mean.
- Justifying exclusion
- Spotting the outlier and justifying the exclusion by reference to the surrounding data, citing the size of the deviation from the cluster.
- Recalculating the mean
- Recomputing the mean from the remaining values after the anomalous value has been excluded.
Label the diagram
Some boxes have lost their names. Pick the right name for each number.
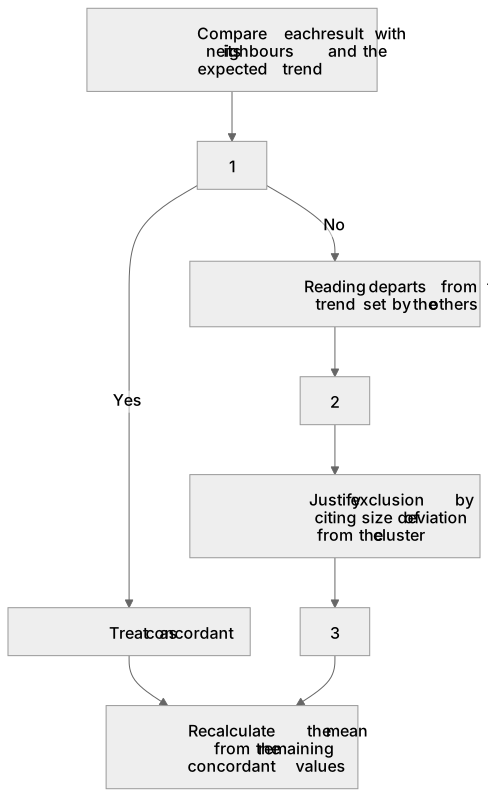
1Box 1
2Box 2
3Box 3
There is more to this lesson
The full lesson goes on to check your understanding and help you earn the marks. Create a free account to carry on, with your progress saved.
A week of Premium from your first lesson · Then the free plan continues · No card, no charge
Test your understanding of Evaluation: (b) the identification of anomalies in experimental measurements
Active recall beats re-reading. Take an instant quiz now to test what you’ve learned and lock it into long-term memory.
A week of Premium from your first lesson · Then the free plan continues · No card, no charge