OCR · A-Level · Chemistry
Course version: H432 · Version from Sept 2017
(i) deduction of the order (0 or 1) with respect to a reactant from the…
Full specification wording
How fast?: (i) deduction of the order (0 or 1) with respect to a reactant from the shape of the graph
You deduce order from a concentration–time graph, not a rate–concentration graph.
- Point 5 of 18
- 4 key terms
Study notes
From the teaching notes for this specification point.
The idea
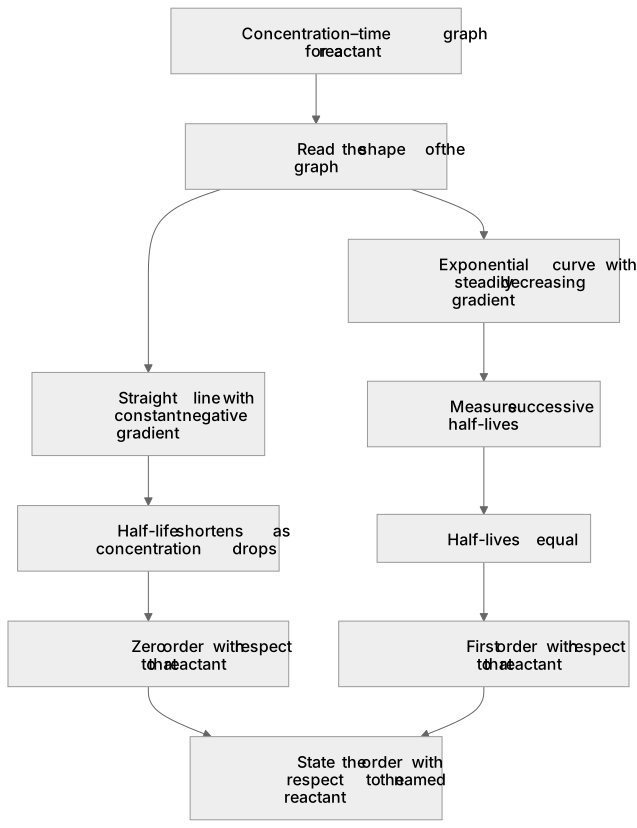
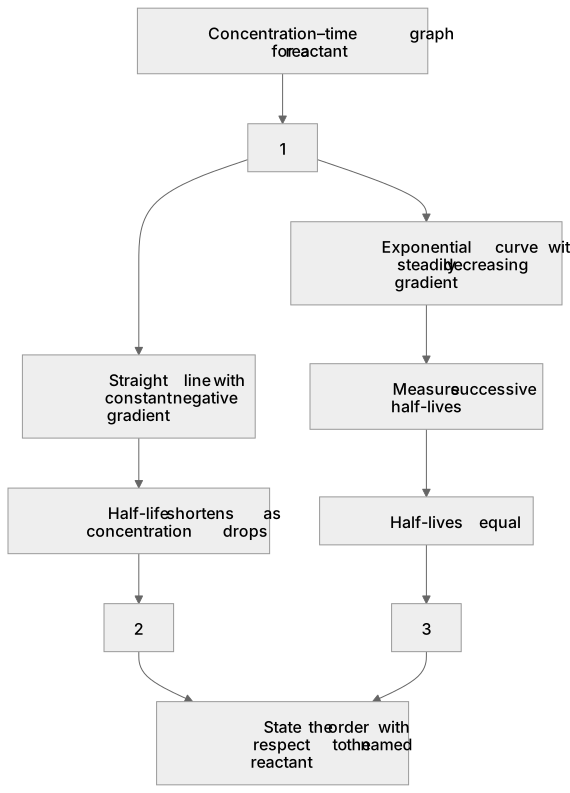
You deduce order from a concentration–time graph, not a rate–concentration graph. Plot concentration of the reactant against time. For zero order the concentration falls at a constant rate, so the graph is a straight line with a constant negative gradient; the half-life shortens as concentration drops. For first order the concentration falls exponentially, giving a curve whose gradient decreases steadily, and crucially the half-life is constant: each successive halving of concentration takes the same time. To test for first order, measure two or three successive half-lives from the graph; equal values confirm first order. A straight line confirms zero order. Read the shape and the half-life pattern together, and remember the order is with respect to that specific reactant.
What earns the marks
- Identifies a straight-line concentration–time graph as zero order with respect to the reactant.
- Identifies an exponential-decay concentration–time curve as first order with respect to the reactant.
- Uses constant successive half-lives read from the graph to confirm first order.
- Uses a changing half-life together with a constant gradient to confirm zero order.
- States the order with respect to the named reactant rather than for the reaction as a whole.
Common mistakes and how to put them right
Reads order from a rate–concentration graph when the question supplies a concentration–time graph.
Put it right: Use the shape of the concentration–time plot.
Calls a straight-line decrease first order.
Put it right: A constant gradient indicates zero order.
Assumes a curved plot is automatically first order without checking half-lives.
Put it right: Confirm constant half-lives before concluding first order.
Gives the overall order when asked for the order with respect to one reactant.
Put it right: Name the reactant.
Exam tips
- Sketch or describe the shape first, then quote half-life evidence to support the order.
- Measure successive half-lives from the graph to distinguish first from zero order.
- State clearly that the order refers to the specified reactant.
Try the lesson
The start of the How fast?: (i) deduction of the order (0 or 1) with respect to a reactant from the shape of the graph lesson, made from teaching notes for this specification point.
Listen
You deduce order from a concentration–time graph, not a rate–concentration graph. Plot concentration of the reactant against time. For zero order the concentration falls at a constant rate, so the graph is a straight line with a constant negative gradient; the half-life shortens as concentration drops. For first order the concentration falls exponentially, giving a curve whose gradient decreases steadily, and crucially the half-life is constant: each successive halving of concentration takes the same time. To test for first order, measure two or three successive half-lives from the graph; equal values confirm first order. A straight line confirms zero order. Read the shape and the half-life pattern together, and remember the order is with respect to that specific reactant. A strong answer earns marks for these points. Identifies a straight-line concentration–time graph as zero order with respect to the reactant. Identifies an exponential-decay concentration–time curve as first order with respect to the reactant. Uses constant successive half-lives read from the graph to confirm first order. Uses a changing half-life together with a constant gradient to confirm zero order. Exam tip: Sketch or describe the shape first, then quote half-life evidence to support the order.
See it
Key words
Say what each word means before you turn the card.
Concentration–time graphs
Try answering aloud or in your head before turning the card.
Zero order: constant gradient
Try answering aloud or in your head before turning the card.
First order: constant half-life
Try answering aloud or in your head before turning the card.
Deducing order with respect to a reactant
Try answering aloud or in your head before turning the card.
See every definition
- Concentration–time graphs
- A plot of the concentration of the reactant against time, from which the order is deduced rather than from a rate–concentration graph.
- Zero order: constant gradient
- The concentration falls at a constant rate, so the graph is a straight line with a constant negative gradient, and the half-life shortens as concentration drops.
- First order: constant half-life
- The concentration falls exponentially, giving a curve whose gradient decreases steadily, and each successive halving of concentration takes the same time.
- Deducing order with respect to a reactant
- Reading the shape and the half-life pattern together, where a straight line confirms zero order and equal successive half-lives confirm first order, with the order stated for that specific reactant.
Label the diagram
Some boxes have lost their names. Pick the right name for each number.
1Box 1
2Box 2
3Box 3
There is more to this lesson
The full lesson goes on to check your understanding and help you earn the marks. Create a free account to carry on, with your progress saved.
A week of Premium from your first lesson · Then the free plan continues · No card, no charge
Test your understanding of How fast?: (i) deduction of the order (0 or 1) with respect to a reactant from the shape of the graph
Active recall beats re-reading. Take an instant quiz now to test what you’ve learned and lock it into long-term memory.
A week of Premium from your first lesson · Then the free plan continues · No card, no charge