OCR · A-Level · Chemistry
Course version: H432 · Version from Sept 2017
(ii) calculation of reaction rates from the measurement of gradients (see…
Full specification wording
How fast?: (ii) calculation of reaction rates from the measurement of gradients (see also 3.2.2 b)
The rate of reaction at a particular moment equals the gradient of the concentration–time graph at that moment.
- Point 6 of 18
- 4 key terms
Study notes
From the teaching notes for this specification point.
The idea
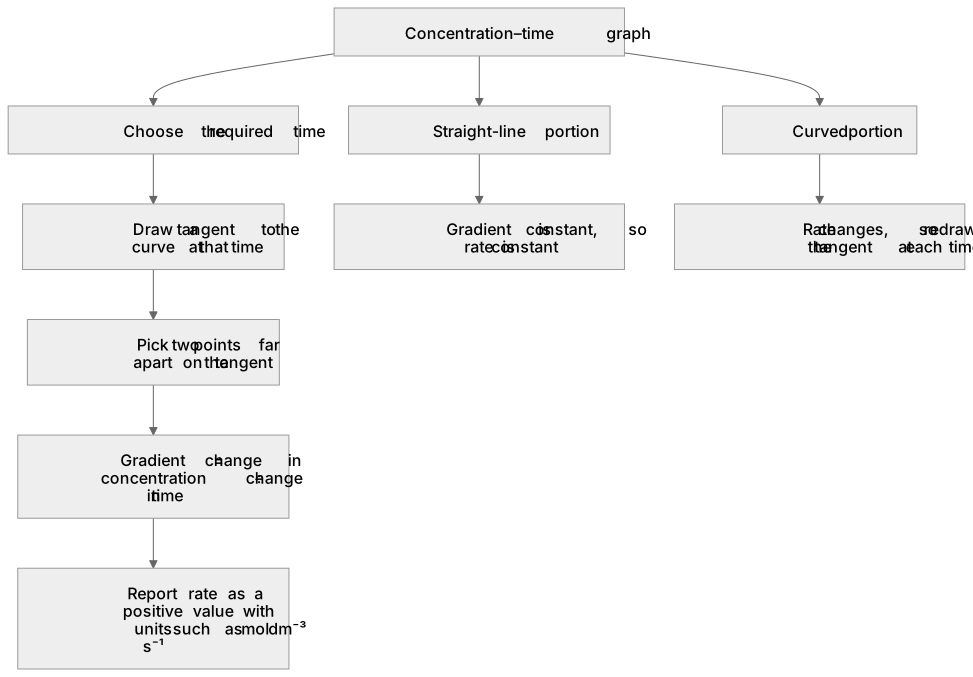
The rate of reaction at a particular moment equals the gradient of the concentration–time graph at that moment. Draw a tangent to the curve at the chosen time, then pick two points far apart on the tangent and calculate gradient = change in concentration ÷ change in time, giving units such as mol dm⁻³ s⁻¹. For a straight-line portion the gradient is constant, so the rate is constant; for a curve the tangent must be redrawn at each time because the rate changes. Take care with signs: concentration falls with time, so the gradient is negative, and the rate is reported as a positive magnitude. Use the tangent, not a chord between two data points, when the rate at that instant is required.
What earns the marks
- Draws a tangent to the concentration–time curve at the required time.
- Calculates the gradient as change in concentration divided by change in time.
- Uses two well-separated points on the tangent to reduce error.
- Gives the rate as a positive value with units such as mol dm⁻³ s⁻¹.
- Recognises that a straight-line graph gives a constant rate equal to its gradient.
Common mistakes and how to put them right
Uses a chord between two data points instead of a tangent.
Put it right: Draw a tangent at the single time to find the instantaneous rate.
Divides change in time by change in concentration.
Put it right: Divide change in concentration by change in time.
Reports a negative rate from the falling gradient.
Put it right: State the rate as a positive magnitude.
Exam tips
- Draw the tangent as long as the grid allows and read points far apart on it.
- Show the substitution of both differences before giving the final rate.
- Include correct units and a positive value in the answer.
Try the lesson
The start of the How fast?: (ii) calculation of reaction rates from the measurement of gradients (see also 3.2.2 b) lesson, made from teaching notes for this specification point.
Listen
The rate of reaction at a particular moment equals the gradient of the concentration–time graph at that moment. Draw a tangent to the curve at the chosen time, then pick two points far apart on the tangent and calculate gradient = change in concentration ÷ change in time, giving units such as mol dm⁻³ s⁻¹. For a straight-line portion the gradient is constant, so the rate is constant; for a curve the tangent must be redrawn at each time because the rate changes. Take care with signs: concentration falls with time, so the gradient is negative, and the rate is reported as a positive magnitude. Use the tangent, not a chord between two data points, when the rate at that instant is required. A strong answer earns marks for these points. Draws a tangent to the concentration–time curve at the required time. Calculates the gradient as change in concentration divided by change in time. Uses two well-separated points on the tangent to reduce error. Gives the rate as a positive value with units such as mol dm⁻³ s⁻¹. Exam tip: Draw the tangent as long as the grid allows and read points far apart on it.
See it
Key words
Say what each word means before you turn the card.
Gradient of concentration–time graph
Try answering aloud or in your head before turning the card.
Tangent method
Try answering aloud or in your head before turning the card.
Instantaneous rate
Try answering aloud or in your head before turning the card.
Units of rate
Try answering aloud or in your head before turning the card.
See every definition
- Gradient of concentration–time graph
- The rate of reaction at a particular moment equals the gradient of the concentration–time graph at that moment.
- Tangent method
- Draw a tangent to the curve at the chosen time, then pick two points far apart on the tangent and calculate the gradient.
- Instantaneous rate
- The rate at that instant is found using the tangent, not a chord between two data points.
- Units of rate
- Calculating gradient as change in concentration divided by change in time gives units such as mol dm⁻³ s⁻¹.
Label the diagram
Some boxes have lost their names. Pick the right name for each number.
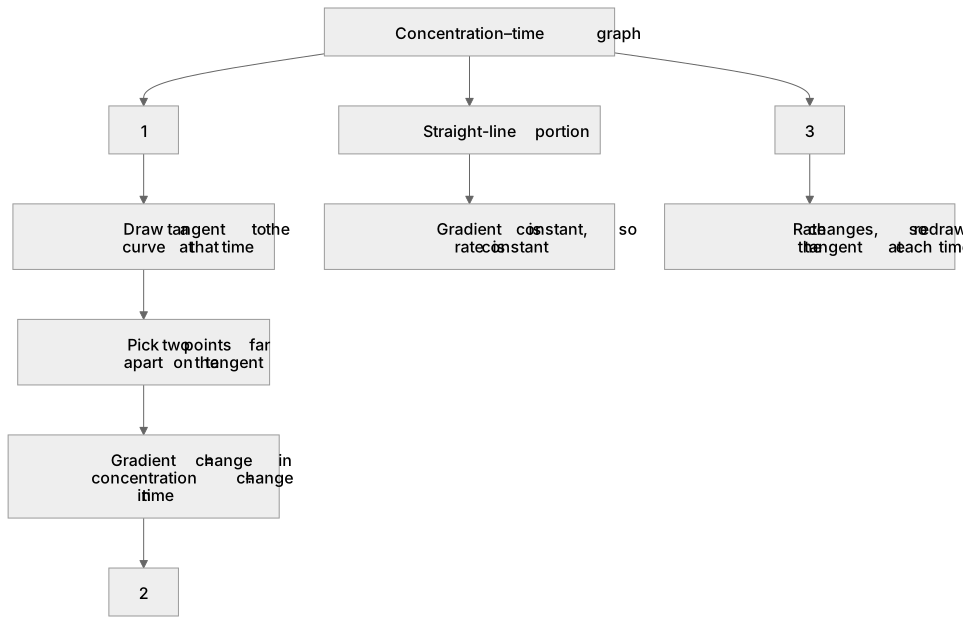
1Box 1
2Box 2
3Box 3
There is more to this lesson
The full lesson goes on to check your understanding and help you earn the marks. Create a free account to carry on, with your progress saved.
A week of Premium from your first lesson · Then the free plan continues · No card, no charge
Test your understanding of How fast?: (ii) calculation of reaction rates from the measurement of gradients (see also 3.2.2 b)
Active recall beats re-reading. Take an instant quiz now to test what you’ve learned and lock it into long-term memory.
A week of Premium from your first lesson · Then the free plan continues · No card, no charge