OCR · A-Level · Chemistry
Course version: H432 · Version from Sept 2017
Implementing: (c) presenting observations and data in an appropriate format.
When you implement a practical, you must present what you observe and measure so another person can read and check it.
- Point 3 of 3
- 4 key terms
Study notes
From the teaching notes for this specification point.
The idea
When you implement a practical, you must present what you observe and measure so another person can read and check it. Observations such as colour changes, gas evolution or precipitate formation are recorded as brief, specific descriptions rather than vague words. Numerical data belong in a table with clear column headings that name the quantity and give its unit, for example 'Volume of acid / cm³'. Record raw readings to the precision of the instrument, keep repeated readings in separate columns, and calculate means or processed values in a further column. A well-set-out table lets a reader follow the method, spot anomalies and repeat the calculation, so the format is part of the evidence of competent practical work.
What earns the marks
- Uses a table with column headings that name each quantity and give its unit.
- Records raw readings to the precision of the instrument used.
- Describes observations specifically, such as a colour change or a precipitate forming.
- Keeps repeated readings separate and places calculated values in their own column.
- Presents data so that anomalies and trends can be identified by a reader.
Common mistakes and how to put them right
Writes headings without units.
Put it right: Include the unit in every heading, for example 'Mass / g'.
Records vague observations such as 'it changed'.
Put it right: Describe the specific change seen.
Mixes raw readings and calculated means in one column.
Put it right: Keep them in separate columns.
Gives readings to more or fewer decimal places than the instrument allows.
Put it right: Match the precision of the apparatus.
Exam tips
- Plan the table before recording so every column has a heading with a quantity and a unit.
- Check that each reading is written to the precision the instrument can actually deliver.
- Use precise observation language, naming the colour, gas or solid rather than saying 'something happened'.
Try the lesson
The start of the Implementing: (c) presenting observations and data in an appropriate format. lesson, made from teaching notes for this specification point.
Listen
When you implement a practical, you must present what you observe and measure so another person can read and check it. Observations such as colour changes, gas evolution or precipitate formation are recorded as brief, specific descriptions rather than vague words. Numerical data belong in a table with clear column headings that name the quantity and give its unit, for example 'Volume of acid / cm³'. Record raw readings to the precision of the instrument, keep repeated readings in separate columns, and calculate means or processed values in a further column. A well-set-out table lets a reader follow the method, spot anomalies and repeat the calculation, so the format is part of the evidence of competent practical work. A strong answer earns marks for these points. Uses a table with column headings that name each quantity and give its unit. Records raw readings to the precision of the instrument used. Describes observations specifically, such as a colour change or a precipitate forming. Keeps repeated readings separate and places calculated values in their own column. Exam tip: Plan the table before recording so every column has a heading with a quantity and a unit.
See it
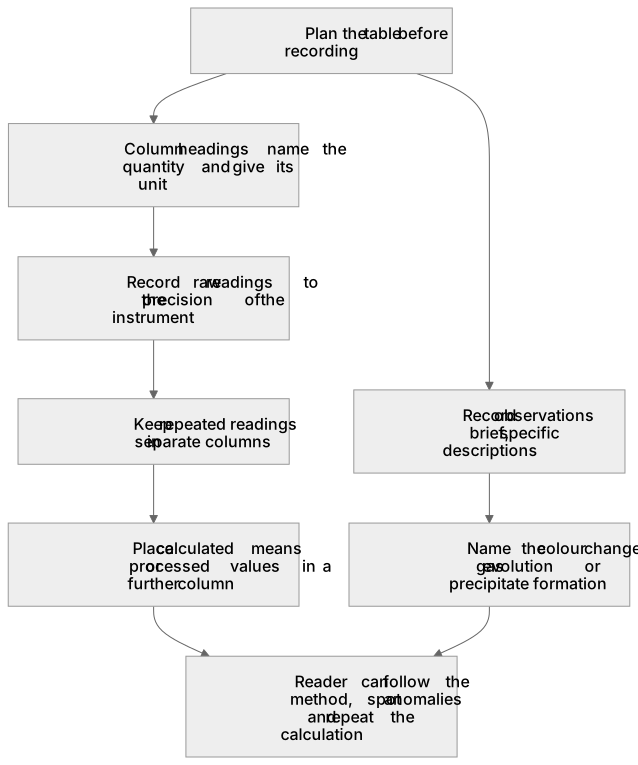
Key words
Say what each word means before you turn the card.
Tabulating data with headed columns
Try answering aloud or in your head before turning the card.
Including units in headings
Try answering aloud or in your head before turning the card.
Recording observations precisely
Try answering aloud or in your head before turning the card.
Separating raw and processed data
Try answering aloud or in your head before turning the card.
See every definition
- Tabulating data with headed columns
- Numerical data belong in a table with clear column headings that name the quantity and give its unit.
- Including units in headings
- Every column heading names the quantity and gives its unit, for example 'Volume of acid / cm³'.
- Recording observations precisely
- Observations such as colour changes, gas evolution or precipitate formation are recorded as brief, specific descriptions rather than vague words.
- Separating raw and processed data
- Raw readings are kept in separate columns, with means or processed values calculated in a further column.
Label the diagram
Some boxes have lost their names. Pick the right name for each number.
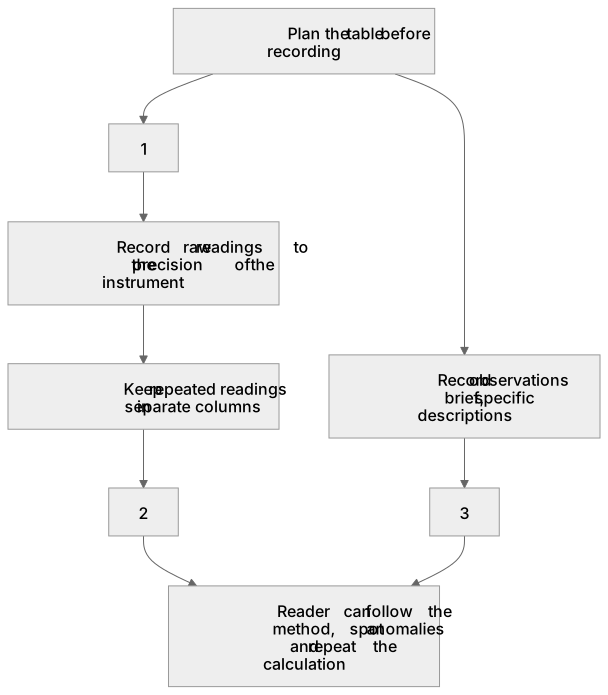
1Box 1
2Box 2
3Box 3
There is more to this lesson
The full lesson goes on to check your understanding and help you earn the marks. Create a free account to carry on, with your progress saved.
A week of Premium from your first lesson · Then the free plan continues · No card, no charge
Test your understanding of Implementing: (c) presenting observations and data in an appropriate format.
Active recall beats re-reading. Take an instant quiz now to test what you’ve learned and lock it into long-term memory.
A week of Premium from your first lesson · Then the free plan continues · No card, no charge