OCR · A-Level · Chemistry
Course version: H432 · Version from Sept 2017
Reaction rates: The Boltzmann distribution
The Boltzmann distribution shows how molecular energies are spread at a given temperature.
- Point 11 of 14
- 4 key terms
Study notes
From the teaching notes for this specification point.
The idea
The Boltzmann distribution shows how molecular energies are spread at a given temperature. The curve starts at the origin (0,0), rises to a peak at the most probable energy, and tails off at higher energies without touching the energy axis. The area under the curve represents the total number of molecules, so it stays constant when temperature changes. Raising the temperature flattens and broadens the curve: the peak moves to higher energy and the tail extends further right, so a greater proportion of molecules have energy at or above the activation energy, Ea. This explains why reaction rate increases with temperature. The distribution applies to gases and to the energies of molecules in a sample; it does not show individual molecules changing energy over time.
What earns the marks
- Describes the curve starting at the origin and rising to a peak before tailing off at high energy.
- Identifies the peak as the most probable energy of the molecules.
- States that the area under the curve represents the total number of molecules and is constant.
- Explains that increasing temperature moves the peak to higher energy and broadens the tail.
- Links the greater area beyond Ea at higher temperature to a higher reaction rate.
Common mistakes and how to put them right
Starts the curve high on the y-axis at zero energy.
Put it right: Begin the curve at the origin (0,0).
Labels the peak as the average energy.
Put it right: Label it as the most probable energy.
Claims the curve touches the energy axis at high energy.
Put it right: Keep the tail asymptotic and never crossing the axis.
Says the total area changes with temperature.
Put it right: Keep the area constant and change only the shape.
Exam tips
- Sketch the curve starting at the origin and label the axes clearly.
- Mark the activation energy Ea on the energy axis and shade the area beyond it.
- Compare two curves at different temperatures on the same axes to show the shift in the peak and tail.
Try the lesson
The start of the Reaction rates: The Boltzmann distribution lesson, made from teaching notes for this specification point.
Listen
The Boltzmann distribution shows how molecular energies are spread at a given temperature. The curve starts at the origin (0,0), rises to a peak at the most probable energy, and tails off at higher energies without touching the energy axis. The area under the curve represents the total number of molecules, so it stays constant when temperature changes. Raising the temperature flattens and broadens the curve: the peak moves to higher energy and the tail extends further right, so a greater proportion of molecules have energy at or above the activation energy, Ea. This explains why reaction rate increases with temperature. The distribution applies to gases and to the energies of molecules in a sample; it does not show individual molecules changing energy over time. A strong answer earns marks for these points. Describes the curve starting at the origin and rising to a peak before tailing off at high energy. Identifies the peak as the most probable energy of the molecules. States that the area under the curve represents the total number of molecules and is constant. Explains that increasing temperature moves the peak to higher energy and broadens the tail. Exam tip: Sketch the curve starting at the origin and label the axes clearly.
See it
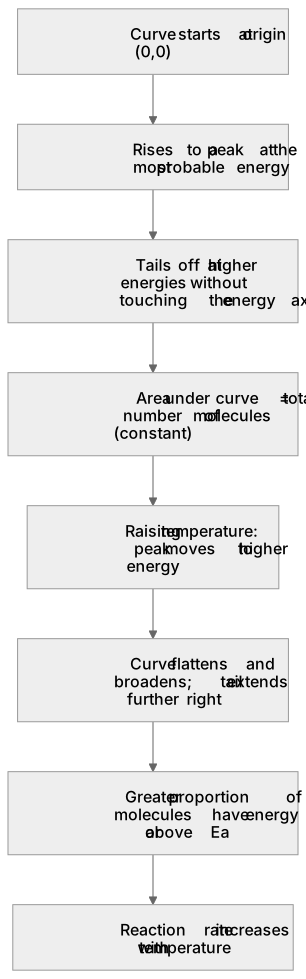
Put it in order
Put these steps in the order they happen.
- 1. Raising temperature: peak moves to higher energy
- 2. Reaction rate increases with temperature
- 3. Curve flattens and broadens; tail extends further right
- 4. Curve starts at origin (0,0)
- 5. Rises to a peak at the most probable energy
- 6. Greater proportion of molecules have energy at or above Ea
- 7. Tails off at higher energies without touching the energy axis
- 8. Area under curve = total number of molecules (constant)
Key words
Say what each word means before you turn the card.
Maxwell–Boltzmann distribution
Try answering aloud or in your head before turning the card.
Most probable energy
Try answering aloud or in your head before turning the card.
Activation energy
Try answering aloud or in your head before turning the card.
Effect of temperature on rate
Try answering aloud or in your head before turning the card.
See every definition
- Maxwell–Boltzmann distribution
- Shows how molecular energies are spread at a given temperature, starting at the origin, rising to a peak and tailing off at higher energies.
- Most probable energy
- The energy at the peak of the curve, where the largest number of molecules have that energy.
- Activation energy
- The energy, Ea, marked on the energy axis; the area beyond it is linked to the rate of a reaction.
- Effect of temperature on rate
- Raising the temperature flattens and broadens the curve, so a greater proportion of molecules have energy at or above Ea, increasing the rate.
Label the diagram
Some boxes have lost their names. Pick the right name for each number.
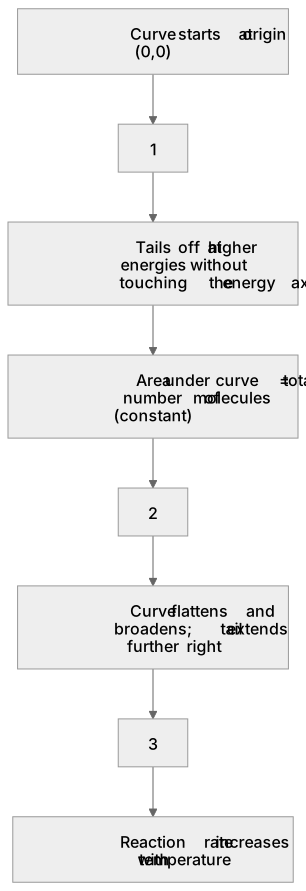
1Box 1
2Box 2
3Box 3
There is more to this lesson
The full lesson goes on to check your understanding and help you earn the marks. Create a free account to carry on, with your progress saved.
A week of Premium from your first lesson · Then the free plan continues · No card, no charge
Test your understanding of Reaction rates: The Boltzmann distribution
Active recall beats re-reading. Take an instant quiz now to test what you’ve learned and lock it into long-term memory.
A week of Premium from your first lesson · Then the free plan continues · No card, no charge