OCR · A-Level · Chemistry
Course version: H432 · Version from Sept 2017
(e) the techniques and procedures used to investigate reaction rates…
Full specification wording
Reaction rates: (e) the techniques and procedures used to investigate reaction rates including the measurement of mass, gas volumes and time
Reaction rates can be followed by measuring a quantity that changes as the reaction proceeds and recording it against time.
- Point 10 of 14
- 4 key terms
Study notes
From the teaching notes for this specification point.
The idea
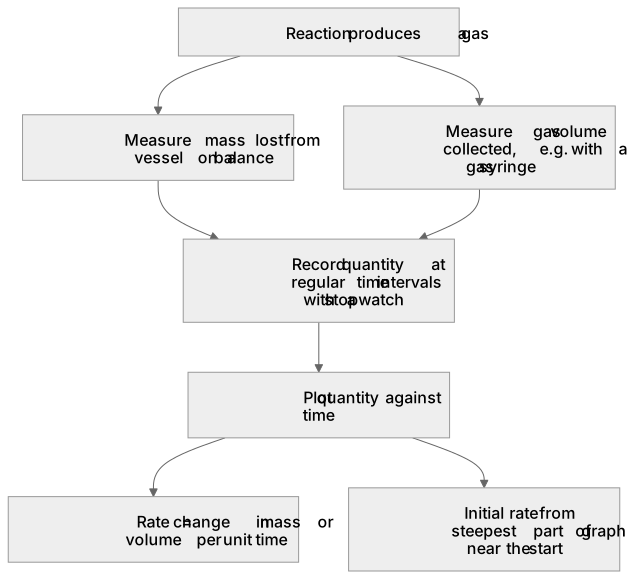
Reaction rates can be followed by measuring a quantity that changes as the reaction proceeds and recording it against time. When a gas is produced, the mass of the reaction vessel can be measured on a balance at intervals; the loss in mass corresponds to gas escaping, so a steeper initial fall means a faster rate. Alternatively, the volume of gas collected can be measured with a gas syringe at intervals; a steeper initial rise in volume means a faster rate. In both methods time is recorded with a stopwatch, readings are taken at regular intervals, and the rate is found from the gradient or from the change in quantity per unit time. The initial rate is usually taken from the steepest part of the graph near the start.
What earns the marks
- Selects measurement of mass lost from the reaction vessel when a gas is produced.
- Selects measurement of gas volume collected, for example with a gas syringe, when a gas is produced.
- Records the measured quantity at regular time intervals using a stopwatch.
- Calculates rate from the change in mass or volume divided by the time taken.
- Uses the steepest initial part of the graph to compare initial rates.
Common mistakes and how to put them right
Measures mass gained when a gas is escaping.
Put it right by measuring the decrease in mass as gas leaves the vessel.
Takes a single reading and calls it the rate.
Put it right by recording the quantity at intervals against time and finding the change per unit time.
Compares total gas volume produced rather than the rate.
Put it right by comparing the gradient or the initial rate, not the final volume.
Exam tips
- State the apparatus and the quantity measured, then say how rate is obtained from the data.
- Use 'change in mass or volume per unit time' to define rate precisely.
- When comparing experiments, compare initial gradients rather than final values.
Try the lesson
The start of the Reaction rates: (e) the techniques and procedures used to investigate reaction rates including the measurement of mass, gas volumes and time lesson, made from teaching notes for this specification point.
Listen
Reaction rates can be followed by measuring a quantity that changes as the reaction proceeds and recording it against time. When a gas is produced, the mass of the reaction vessel can be measured on a balance at intervals; the loss in mass corresponds to gas escaping, so a steeper initial fall means a faster rate. Alternatively, the volume of gas collected can be measured with a gas syringe at intervals; a steeper initial rise in volume means a faster rate. In both methods time is recorded with a stopwatch, readings are taken at regular intervals, and the rate is found from the gradient or from the change in quantity per unit time. The initial rate is usually taken from the steepest part of the graph near the start. A strong answer earns marks for these points. Selects measurement of mass lost from the reaction vessel when a gas is produced. Selects measurement of gas volume collected, for example with a gas syringe, when a gas is produced. Records the measured quantity at regular time intervals using a stopwatch. Calculates rate from the change in mass or volume divided by the time taken. A common slip: Measures mass gained when a gas is escaping. Instead, measuring the decrease in mass as gas leaves the vessel. Exam tip: State the apparatus and the quantity measured, then say how rate is obtained from the data.
See it
Key words
Say what each word means before you turn the card.
Measuring rates of reaction
Try answering aloud or in your head before turning the card.
Mass loss and gas volume methods
Try answering aloud or in your head before turning the card.
Recording time and plotting graphs
Try answering aloud or in your head before turning the card.
Initial rate from gradients
Try answering aloud or in your head before turning the card.
See every definition
- Measuring rates of reaction
- Following a reaction by measuring a quantity that changes as the reaction proceeds and recording it against time.
- Mass loss and gas volume methods
- When a gas is produced, measuring the mass lost from the reaction vessel on a balance, or measuring the volume of gas collected with a gas syringe.
- Recording time and plotting graphs
- Recording the measured quantity at regular intervals using a stopwatch, so that the rate is found from the gradient or from the change in quantity per unit time.
- Initial rate from gradients
- The rate taken from the steepest part of the graph near the start, used to compare initial rates.
Label the diagram
Some boxes have lost their names. Pick the right name for each number.
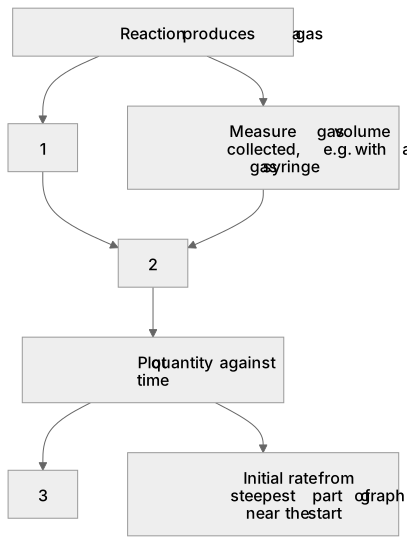
1Box 1
2Box 2
3Box 3
There is more to this lesson
The full lesson goes on to check your understanding and help you earn the marks. Create a free account to carry on, with your progress saved.
A week of Premium from your first lesson · Then the free plan continues · No card, no charge
Test your understanding of Reaction rates: (e) the techniques and procedures used to investigate reaction rates including the measurement of mass, gas volumes and time
Active recall beats re-reading. Take an instant quiz now to test what you’ve learned and lock it into long-term memory.
A week of Premium from your first lesson · Then the free plan continues · No card, no charge