OCR · A-Level · Chemistry
Course version: H432 · Version from Sept 2017
Use of apparatus and techniques: (ii) a continuous monitoring method.
A continuous monitoring method records a changing quantity repeatedly or continuously while a process runs, rather than taking one reading at the end.
- Point 17 of 17
- 4 key terms
Study notes
From the teaching notes for this specification point.
The idea
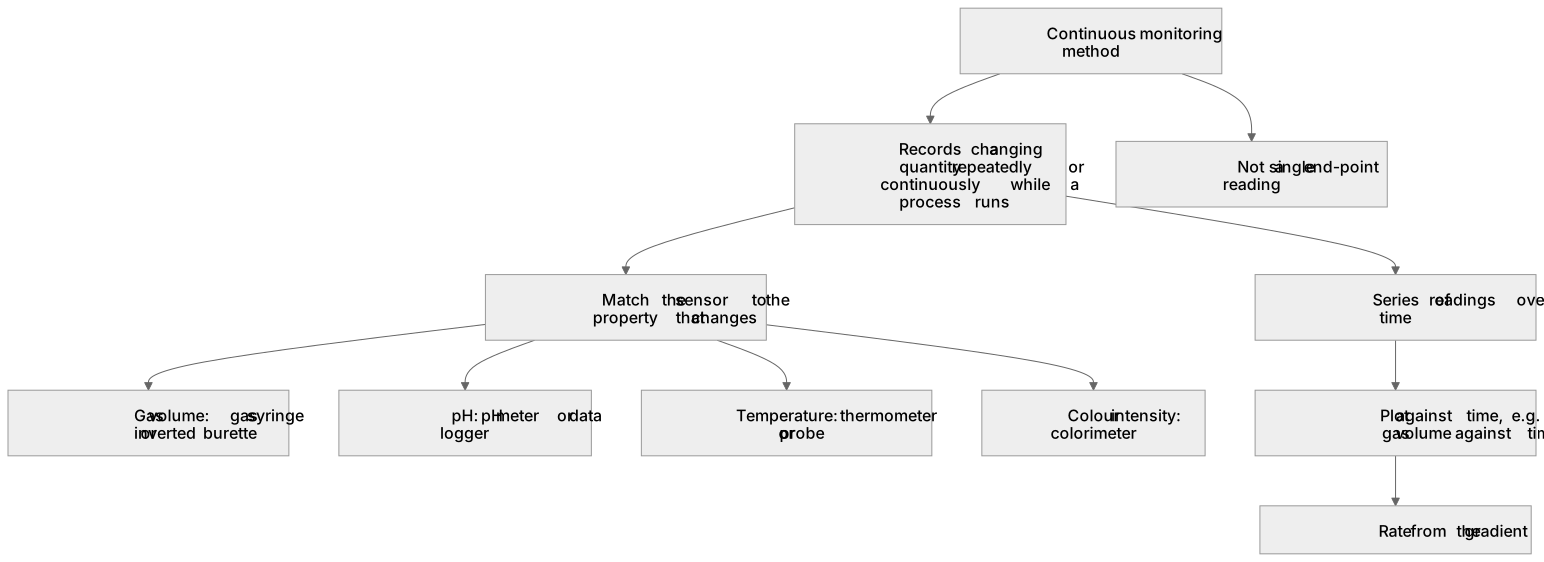
A continuous monitoring method records a changing quantity repeatedly or continuously while a process runs, rather than taking one reading at the end. In chemistry this includes measuring gas volume collected over time with a gas syringe or inverted burette, following pH with a pH meter or data logger, tracking temperature with a thermometer or probe, and recording colour intensity with a colorimeter. The method suits rate experiments because it produces a series of readings from which a rate can be found, for example plotting gas volume against time and taking the gradient. Choosing it means matching the property that changes to a sensor or measuring device that can log it without interrupting the reaction.
What earns the marks
- Identifies a continuous monitoring method as one that records a changing quantity repeatedly or continuously during a process rather than a single end-point reading.
- Selects an appropriate technique for the property that changes, such as gas volume with a gas syringe or pH with a pH meter.
- Explains that a series of readings over time allows a rate to be determined, for example from the gradient of a volume–time graph.
- Distinguishes continuous monitoring from a single measurement such as a final titration reading or one thermometer reading.
Common mistakes and how to put them right
Treats a single end-point titration reading as continuous monitoring.
Put it right: Recognise that continuous monitoring needs repeated readings during the process.
Chooses a technique that measures a property which does not change in the reaction.
Put it right: Match the sensor to the quantity that actually varies.
Assumes any repeated reading is continuous monitoring without linking readings to time.
Put it right: Record the time alongside each reading so a rate can be found.
Exam tips
- Name the specific apparatus or sensor and state the property it records, such as gas volume or pH.
- State that readings are taken at intervals or logged continuously and plotted against time.
- Link the method to how a rate is obtained, for example from the gradient of the graph.
Try the lesson
The start of the Use of apparatus and techniques: (ii) a continuous monitoring method. lesson, made from teaching notes for this specification point.
Listen
A continuous monitoring method records a changing quantity repeatedly or continuously while a process runs, rather than taking one reading at the end. In chemistry this includes measuring gas volume collected over time with a gas syringe or inverted burette, following pH with a pH meter or data logger, tracking temperature with a thermometer or probe, and recording colour intensity with a colorimeter. The method suits rate experiments because it produces a series of readings from which a rate can be found, for example plotting gas volume against time and taking the gradient. Choosing it means matching the property that changes to a sensor or measuring device that can log it without interrupting the reaction. A strong answer earns marks for these points. Identifies a continuous monitoring method as one that records a changing quantity repeatedly or continuously during a process rather than a single end-point reading. Selects an appropriate technique for the property that changes, such as gas volume with a gas syringe or pH with a pH meter. Explains that a series of readings over time allows a rate to be determined, for example from the gradient of a volume–time graph. Distinguishes continuous monitoring from a single measurement such as a final titration reading or one thermometer reading. Exam tip: Name the specific apparatus or sensor and state the property it records, such as gas volume or pH.
See it
Key words
Say what each word means before you turn the card.
Continuous monitoring method
Try answering aloud or in your head before turning the card.
Matching apparatus to the changing property
Try answering aloud or in your head before turning the card.
Collecting data over time to determine rate
Try answering aloud or in your head before turning the card.
Interpreting graphs of quantity against time
Try answering aloud or in your head before turning the card.
See every definition
- Continuous monitoring method
- A method that records a changing quantity repeatedly or continuously while a process runs, rather than taking one reading at the end.
- Matching apparatus to the changing property
- Choosing a sensor or measuring device that can log the property that changes without interrupting the reaction.
- Collecting data over time to determine rate
- Producing a series of readings from which a rate can be found, for example plotting gas volume against time and taking the gradient.
- Interpreting graphs of quantity against time
- Plotting readings against time so that a rate can be found, for example from the gradient of a volume–time graph.
Label the diagram
Some boxes have lost their names. Pick the right name for each number.
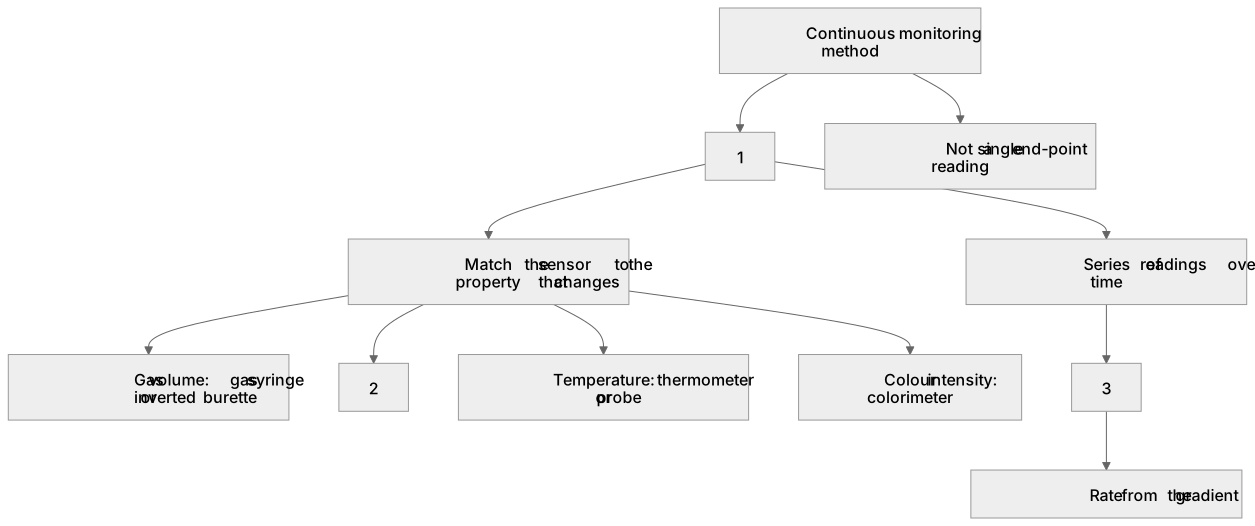
1Box 1
2Box 2
3Box 3
There is more to this lesson
The full lesson goes on to check your understanding and help you earn the marks. Create a free account to carry on, with your progress saved.
A week of Premium from your first lesson · Then the free plan continues · No card, no charge
Test your understanding of Use of apparatus and techniques: (ii) a continuous monitoring method.
Active recall beats re-reading. Take an instant quiz now to test what you’ve learned and lock it into long-term memory.
A week of Premium from your first lesson · Then the free plan continues · No card, no charge