
Study Notes

Overview
Welcome to the essential Edexcel GCSE Economics guide on Demand. This topic is a cornerstone of microeconomics, exploring how consumers make decisions and how markets function. Examiners expect candidates to demonstrate a precise understanding of the difference between a change in price causing a 'movement along' the demand curve and a non-price factor causing a 'shift' of the entire curve. This guide will equip you with the core knowledge, from the fundamental Law of Demand to the analytical tool of Price Elasticity of Demand (PED). You will learn how to draw and interpret demand-related diagrams accurately, apply your knowledge to real-world case studies, and construct evaluative arguments that access the highest mark bands. Mastering demand is not just about learning definitions; it's about understanding the dynamic forces that shape the economy around you.
The Law of Demand and the Demand Curve
What it is: The Law of Demand states that, ceteris paribus (meaning 'all other things being equal'), as the price of a good or service falls, the quantity demanded will increase, and vice versa. This inverse relationship is fundamental to all market analysis.
Why it matters: This concept is the building block for understanding how markets work. It is represented visually by the demand curve, a downward-sloping line on a graph. Marks are consistently awarded for drawing this diagram correctly, with 'Price' on the vertical (Y) axis and 'Quantity' on the horizontal (X) axis. Forgetting to label your axes is a common mistake that instantly loses marks.
Movements vs. Shifts: The Critical Distinction
This is the area where candidates most often lose marks. A clear understanding here is essential for a high grade.
Movements Along the Demand Curve
What happens: A change in the price of the good itself causes a movement along the existing demand curve. A price decrease leads to an extension or expansion in quantity demanded (a move down the curve). A price increase leads to a contraction in quantity demanded (a move up the curve).
Examiner Language: Use the phrase 'change in quantity demanded' when describing a movement.
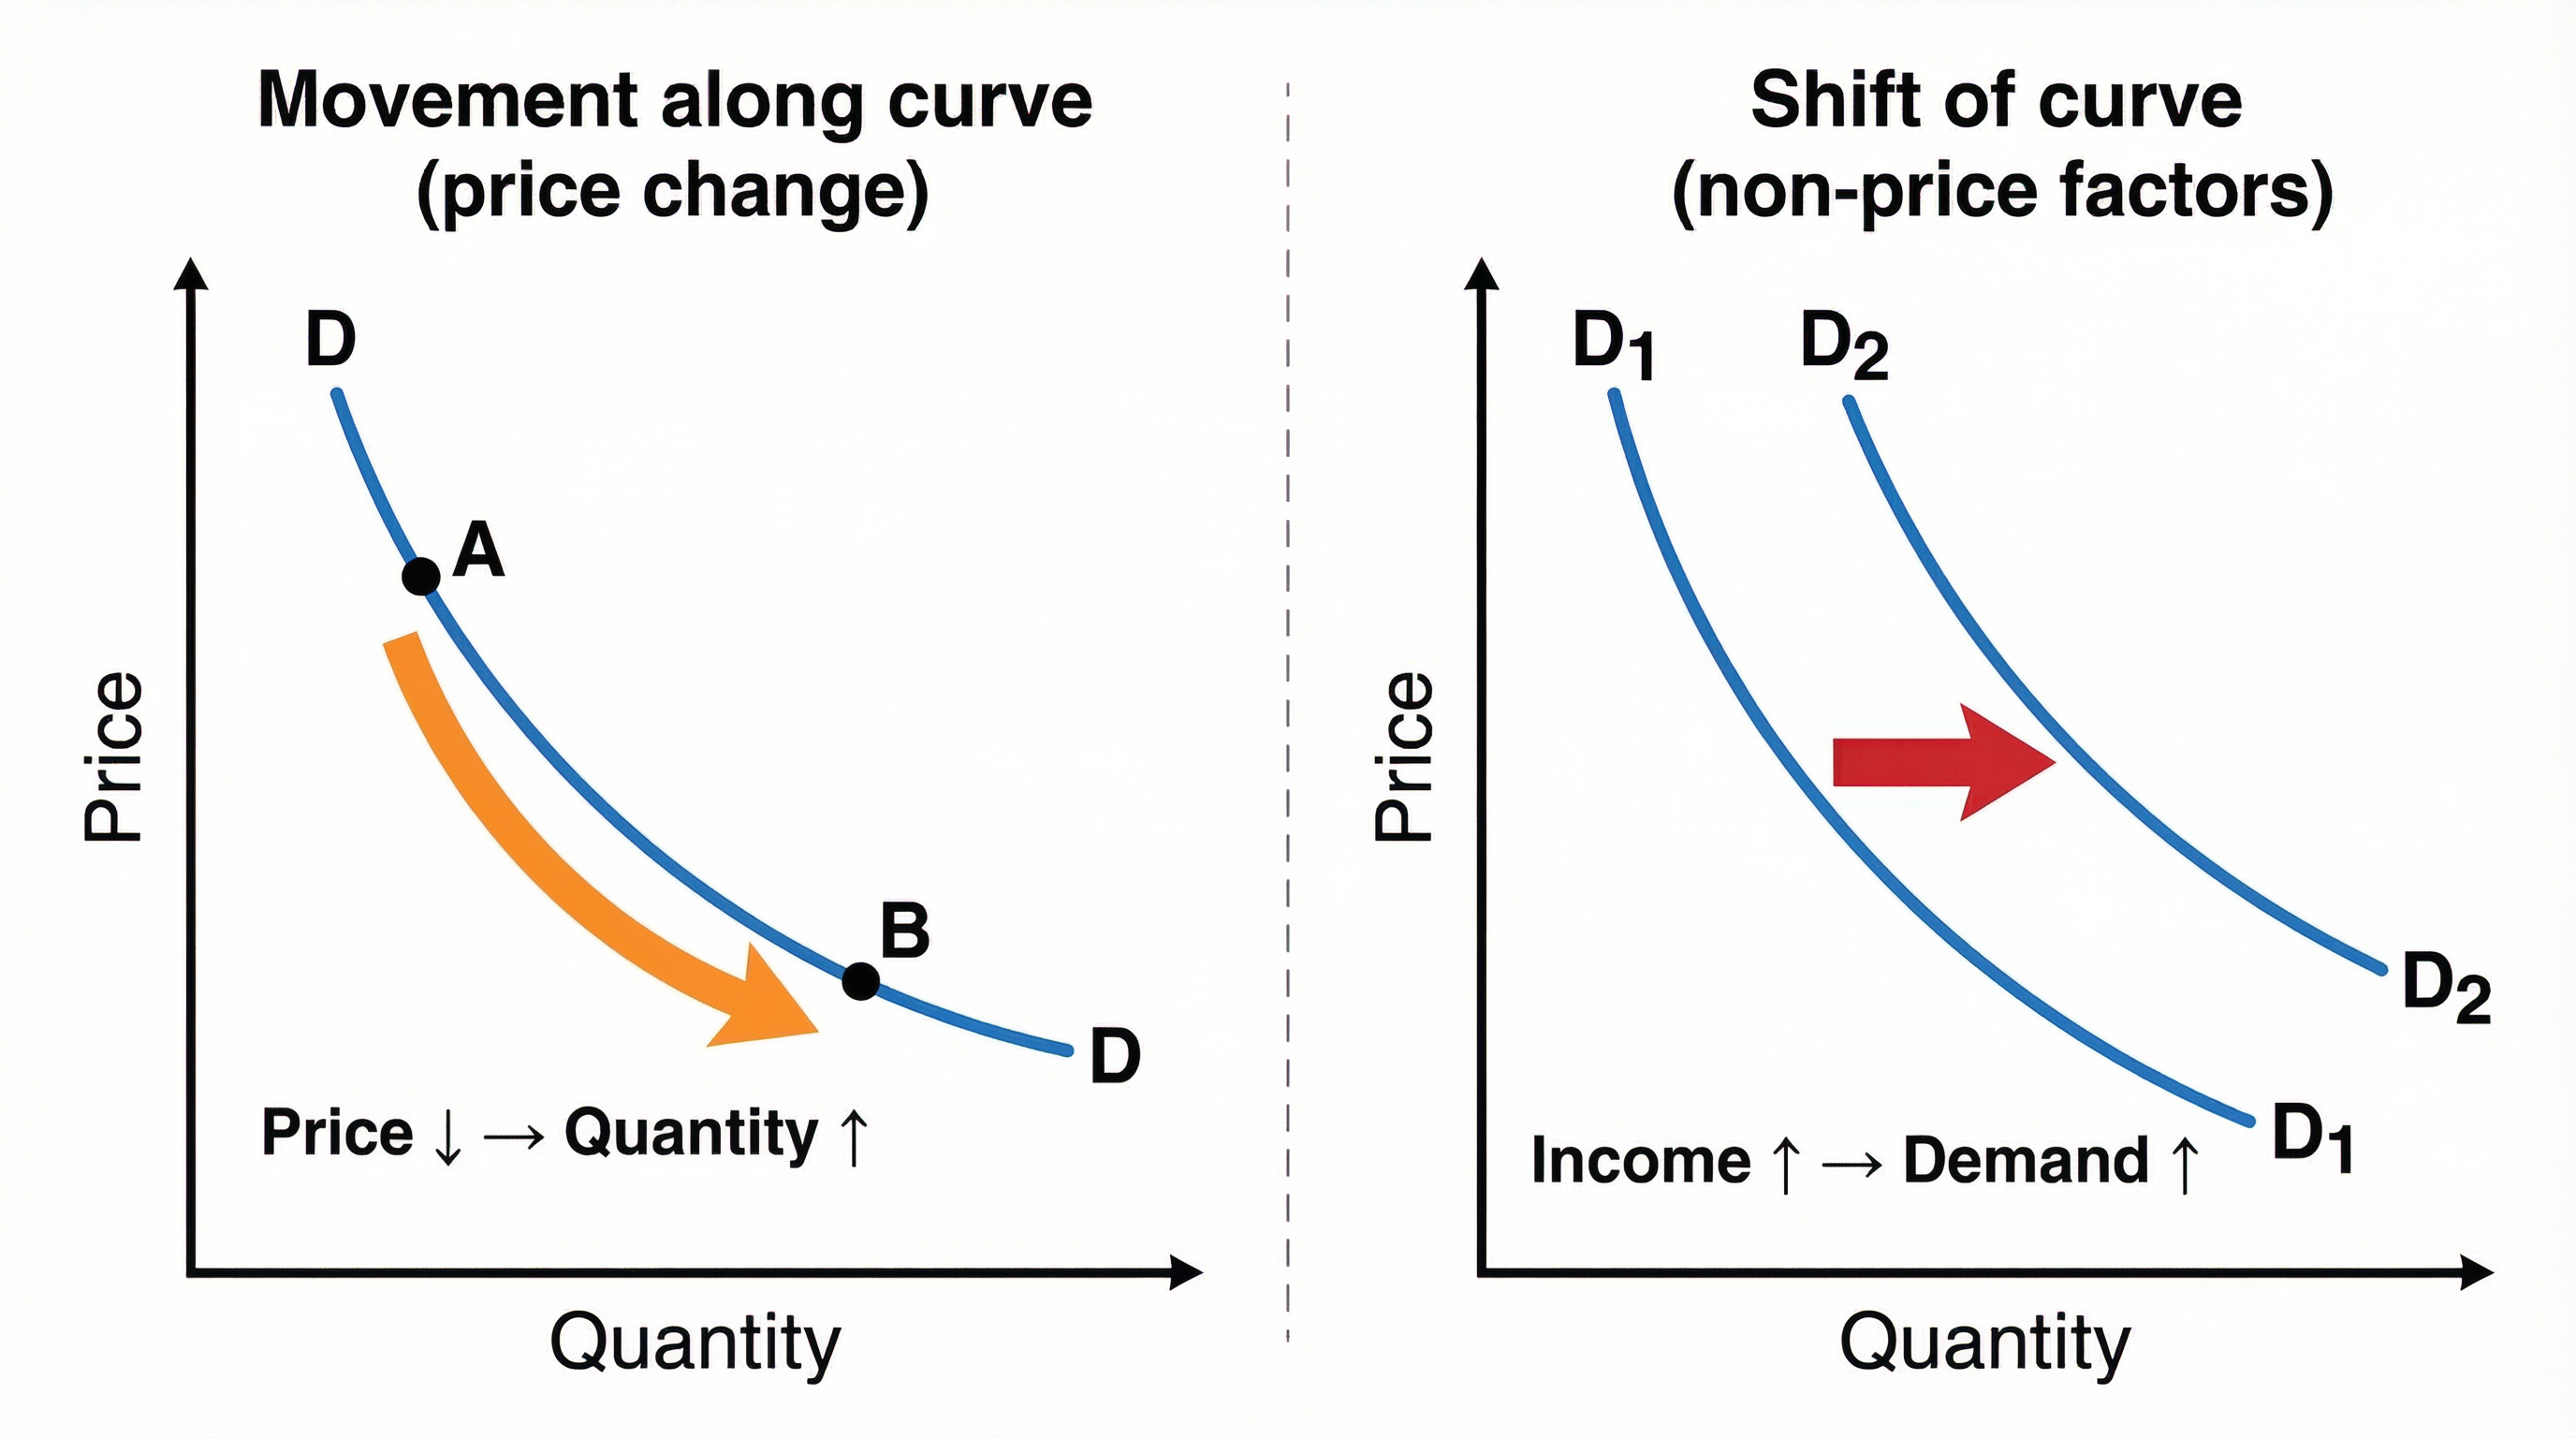
Shifts of the Demand Curve
What happens: A change in any factor other than price that affects demand will cause the entire demand curve to shift to a new position. A shift to the right indicates an increase in demand at every price. A shift to the left indicates a decrease in demand at every price.
Examiner Language: Use the phrase 'change in demand' when describing a shift.
Specific Knowledge: You must know the non-price factors that cause shifts. The mnemonic PASIFIC is an excellent memory hook for this.

Price Elasticity of Demand (PED)
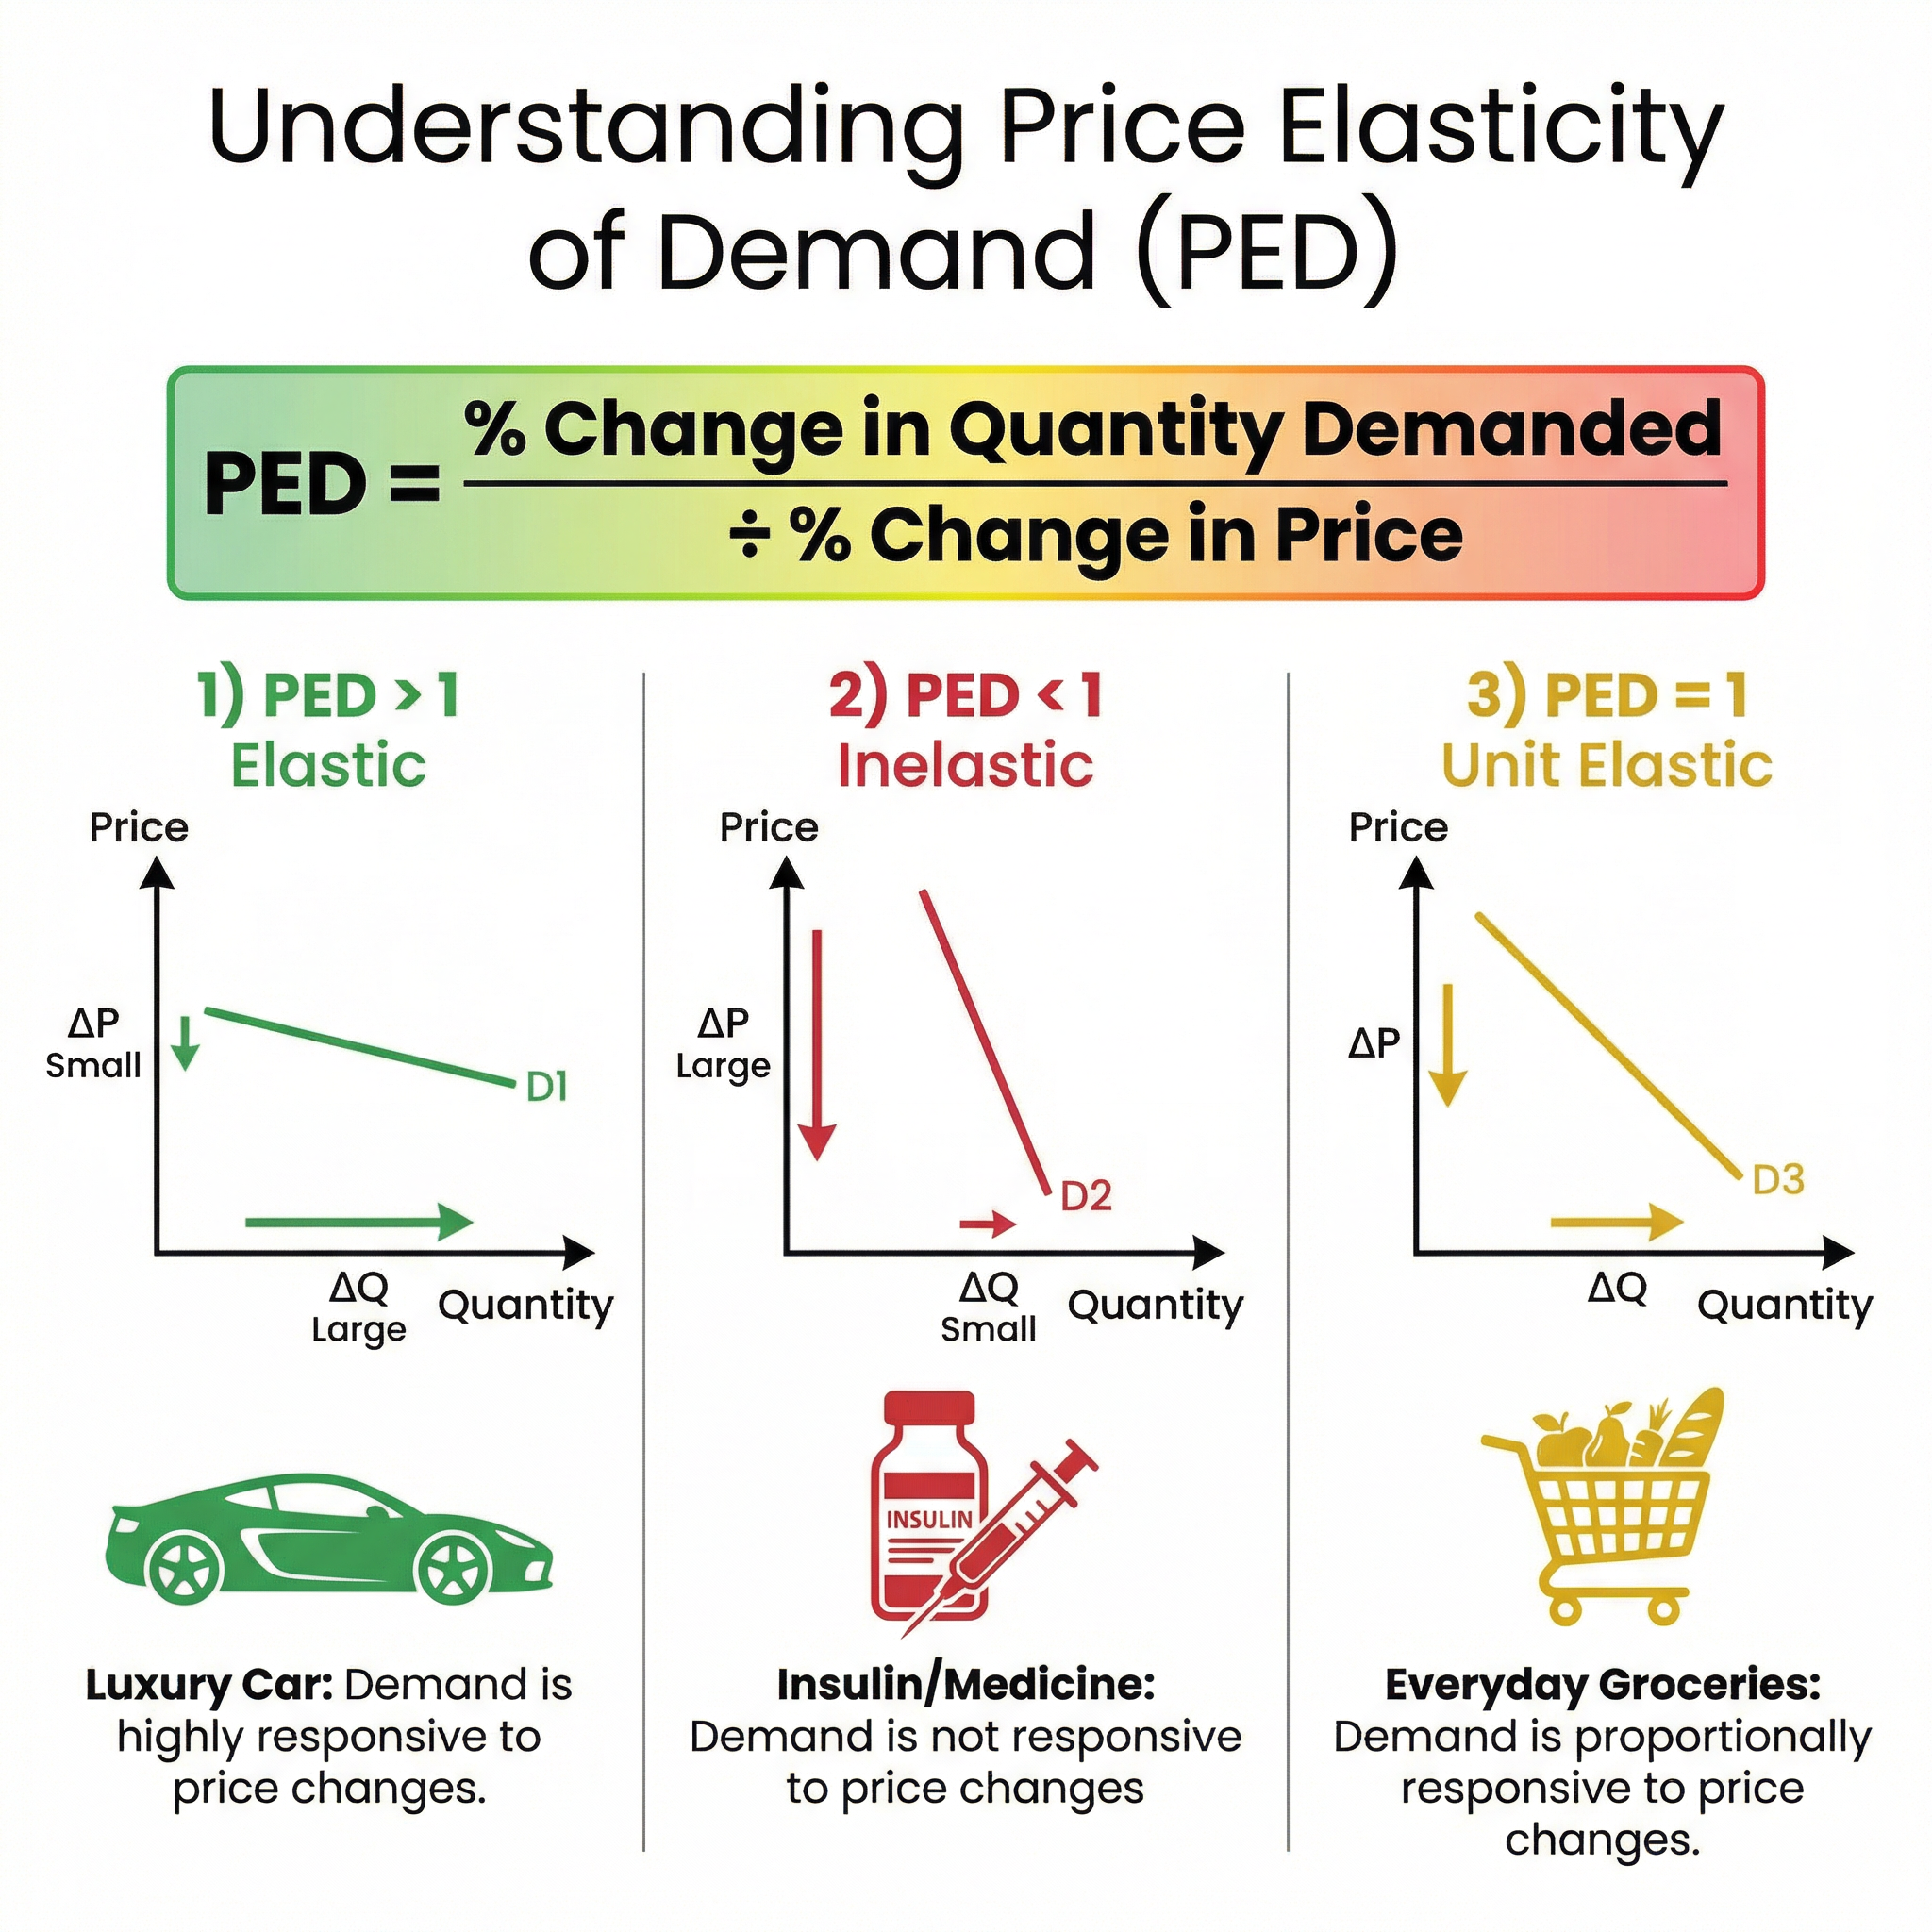
What it is: PED measures the responsiveness of quantity demanded to a change in price. It's a crucial tool for firms making pricing decisions and for governments considering taxes.
The Formula: You must state the formula to gain method marks.
PED = % Change in Quantity Demanded / % Change in Price
Interpreting the Values:
- PED > 1 (Elastic): Quantity demanded is very responsive to price changes (e.g., luxury goods, items with many substitutes).
- PED < 1 (Inelastic): Quantity demanded is not very responsive to price changes (e.g., necessities, addictive goods).
- PED = 1 (Unit Elastic): Quantity demanded changes by the exact same percentage as the price.
Podcast: Mastering Demand
For an in-depth audio breakdown of these concepts, exam tips, and a quick-fire quiz, listen to our dedicated podcast episode.