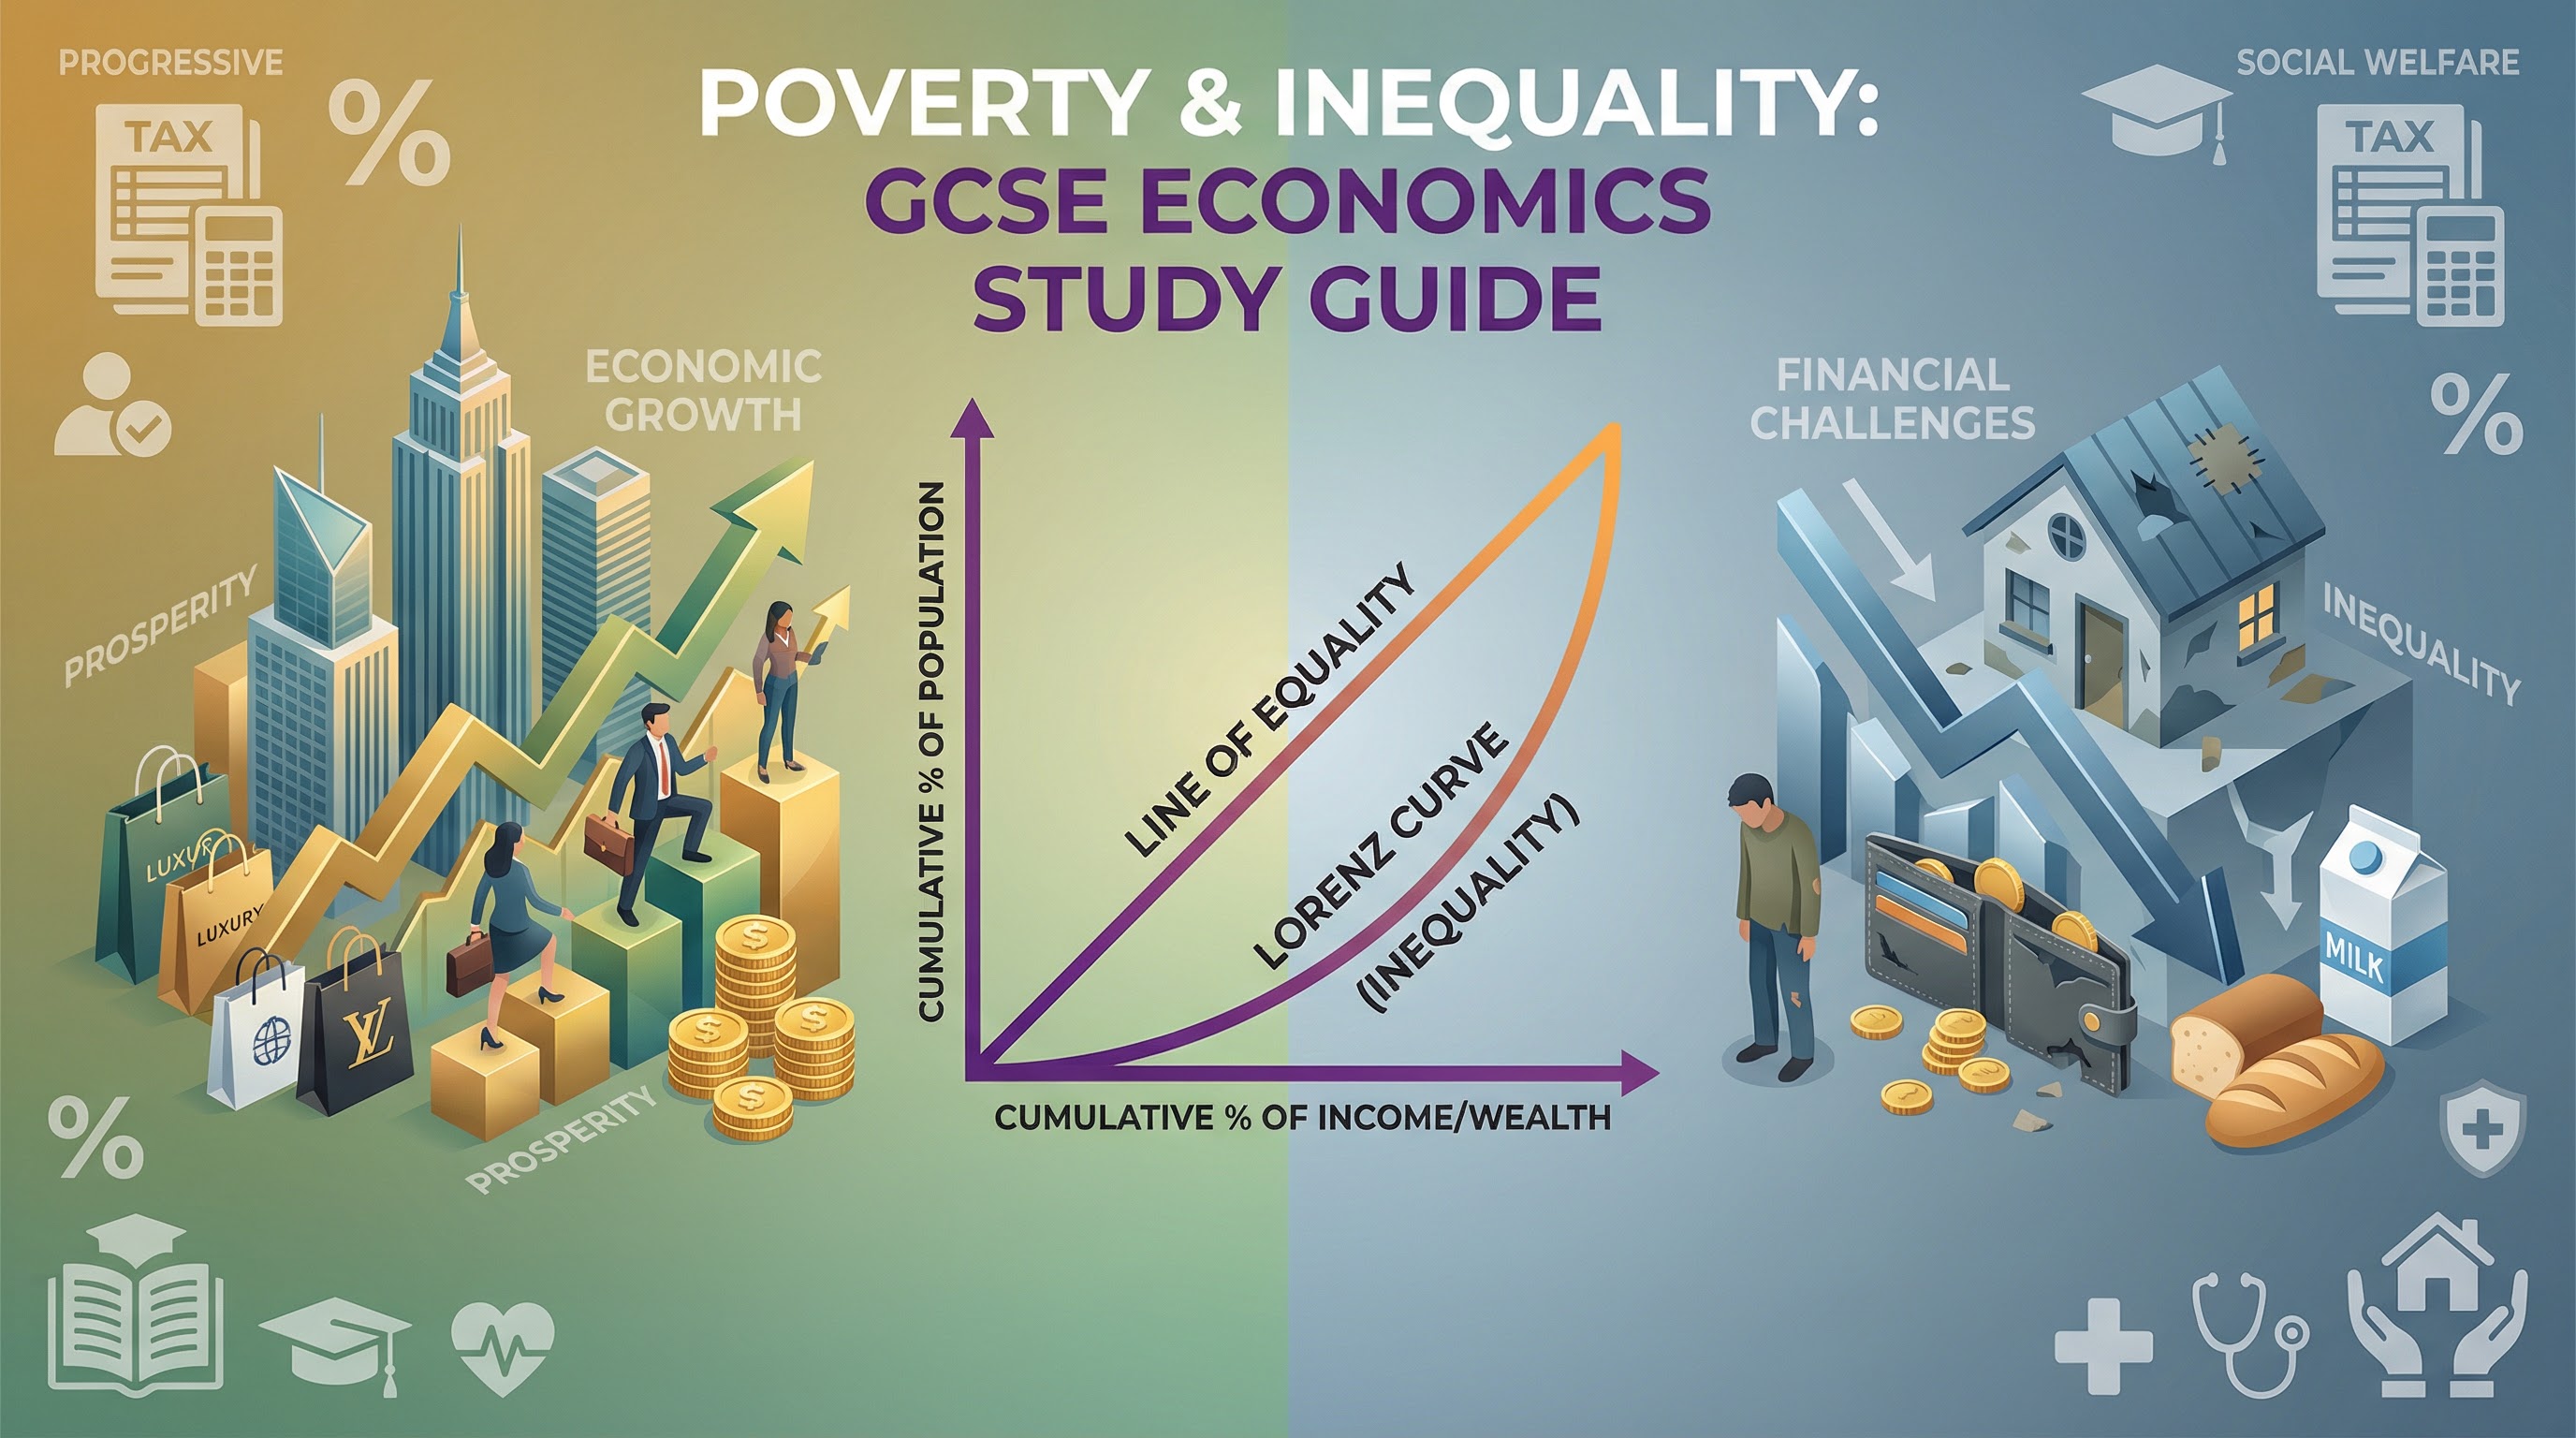
Poverty and Inequality — OCR GCSE Study Guide
Exam Board: OCR | Level: GCSE
This study guide provides a comprehensive overview of Poverty and Inequality for OCR GCSE Economics (J205). It is designed to help students master the key concepts, analytical tools, and evaluation skills required to achieve top marks in their exams.
## Overview
Poverty and inequality are fundamental economic issues that have significant social and political consequences. For OCR GCSE Economics, candidates are expected to demonstrate a precise understanding of how these concepts are defined, measured, and addressed through government policy. This topic requires a blend of theoretical knowledge and practical application, particularly in interpreting data and evaluating the effectiveness of different interventions. Examiners will award credit for a clear distinction between absolute and relative poverty, accurate use of tools like the Lorenz curve and Gini coefficient, and a nuanced evaluation of the trade-offs between equity and efficiency. This guide will equip you with the specific knowledge and skills needed to confidently tackle any question on this topic.
{{asset:poverty_and_inequality_podcast.mp3}}
## Key Concepts & Definitions
### Absolute vs. Relative Poverty
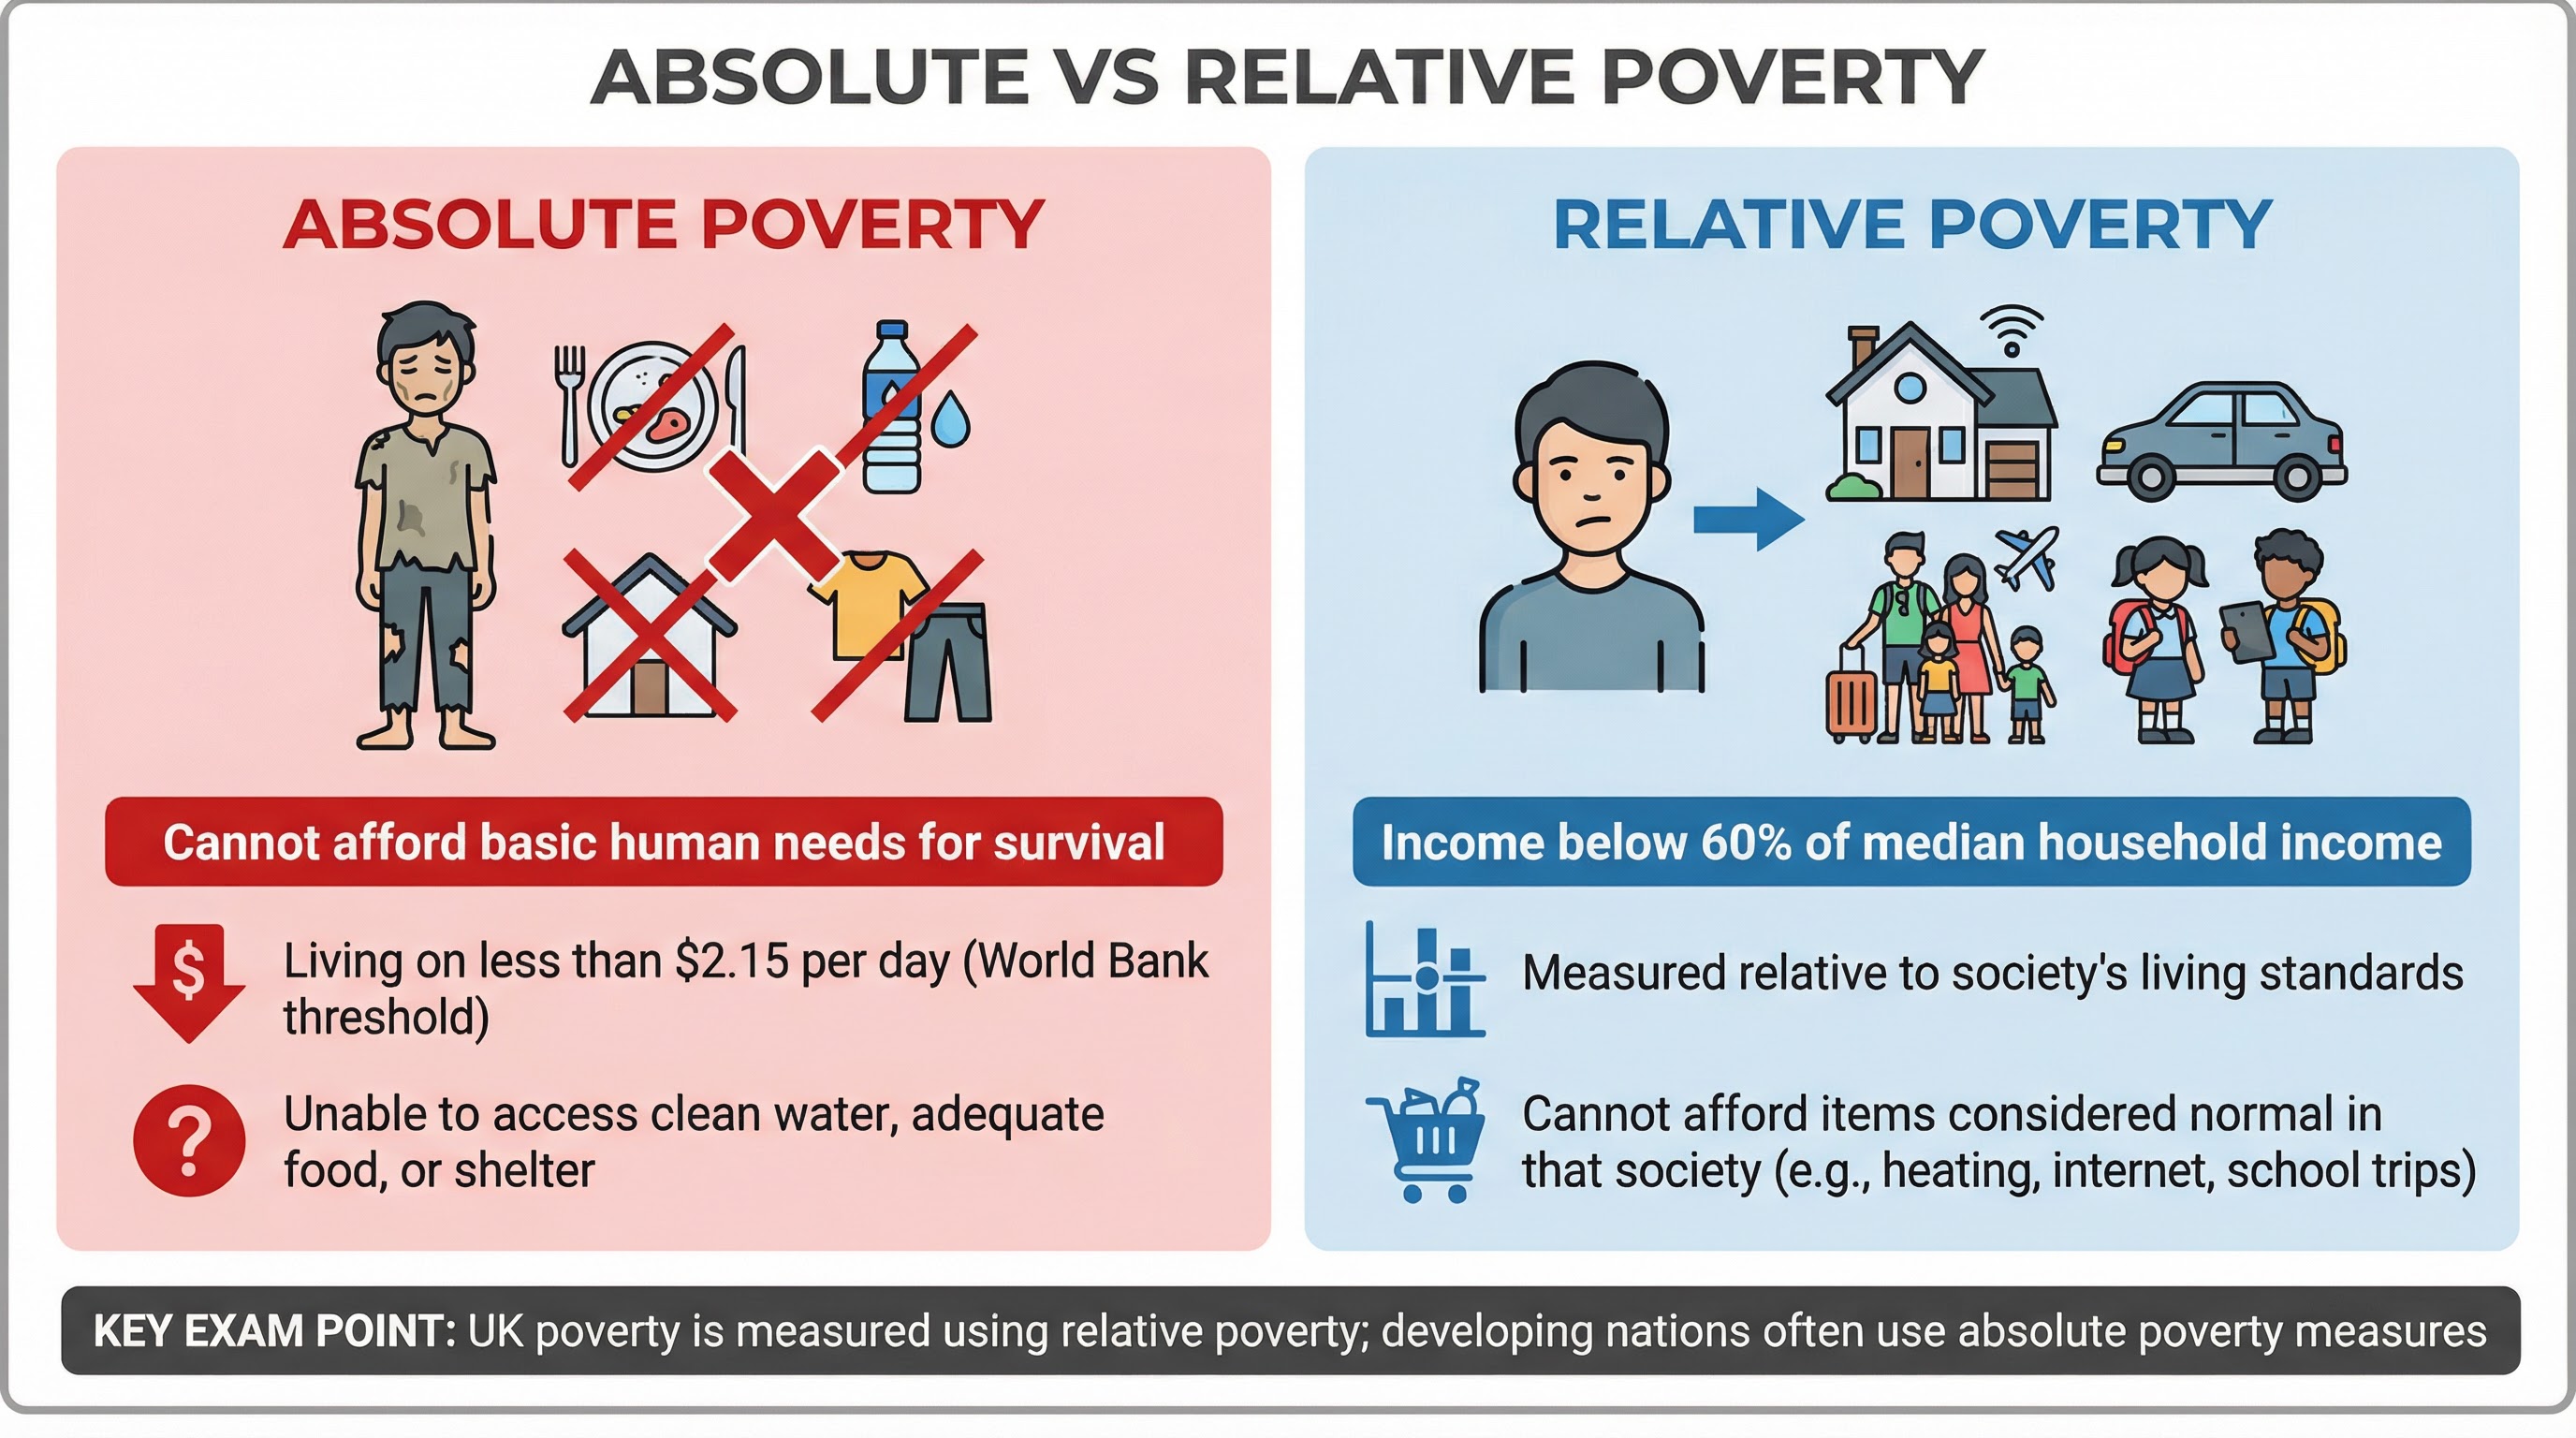
**Absolute Poverty**: A condition where individuals lack the minimum resources to meet their basic human needs for survival, such as food, water, shelter, and clothing. The World Bank currently defines this as living on less than $2.15 a day. This measure is most relevant for developing countries.
**Relative Poverty**: A condition where an individual's income is significantly lower than the median income in their society. In the UK, this is officially defined as having a household income below 60% of the median. This means individuals are excluded from the normal living patterns, customs, and activities of that society. This is the primary measure used in the UK and other developed nations.
### Income vs. Wealth Inequality
**Income Inequality**: Refers to the extent to which income is distributed unevenly across a population. Income is a **flow** concept, meaning it is measured over a period of time (e.g., weekly wages, monthly salary).
**Wealth Inequality**: Refers to the unequal distribution of assets (e.g., property, savings, stocks) minus liabilities within a population. Wealth is a **stock** concept, representing the value of assets at a single point in time. Wealth inequality is typically much greater than income inequality.
## Measuring Inequality
### The Lorenz Curve and Gini Coefficient
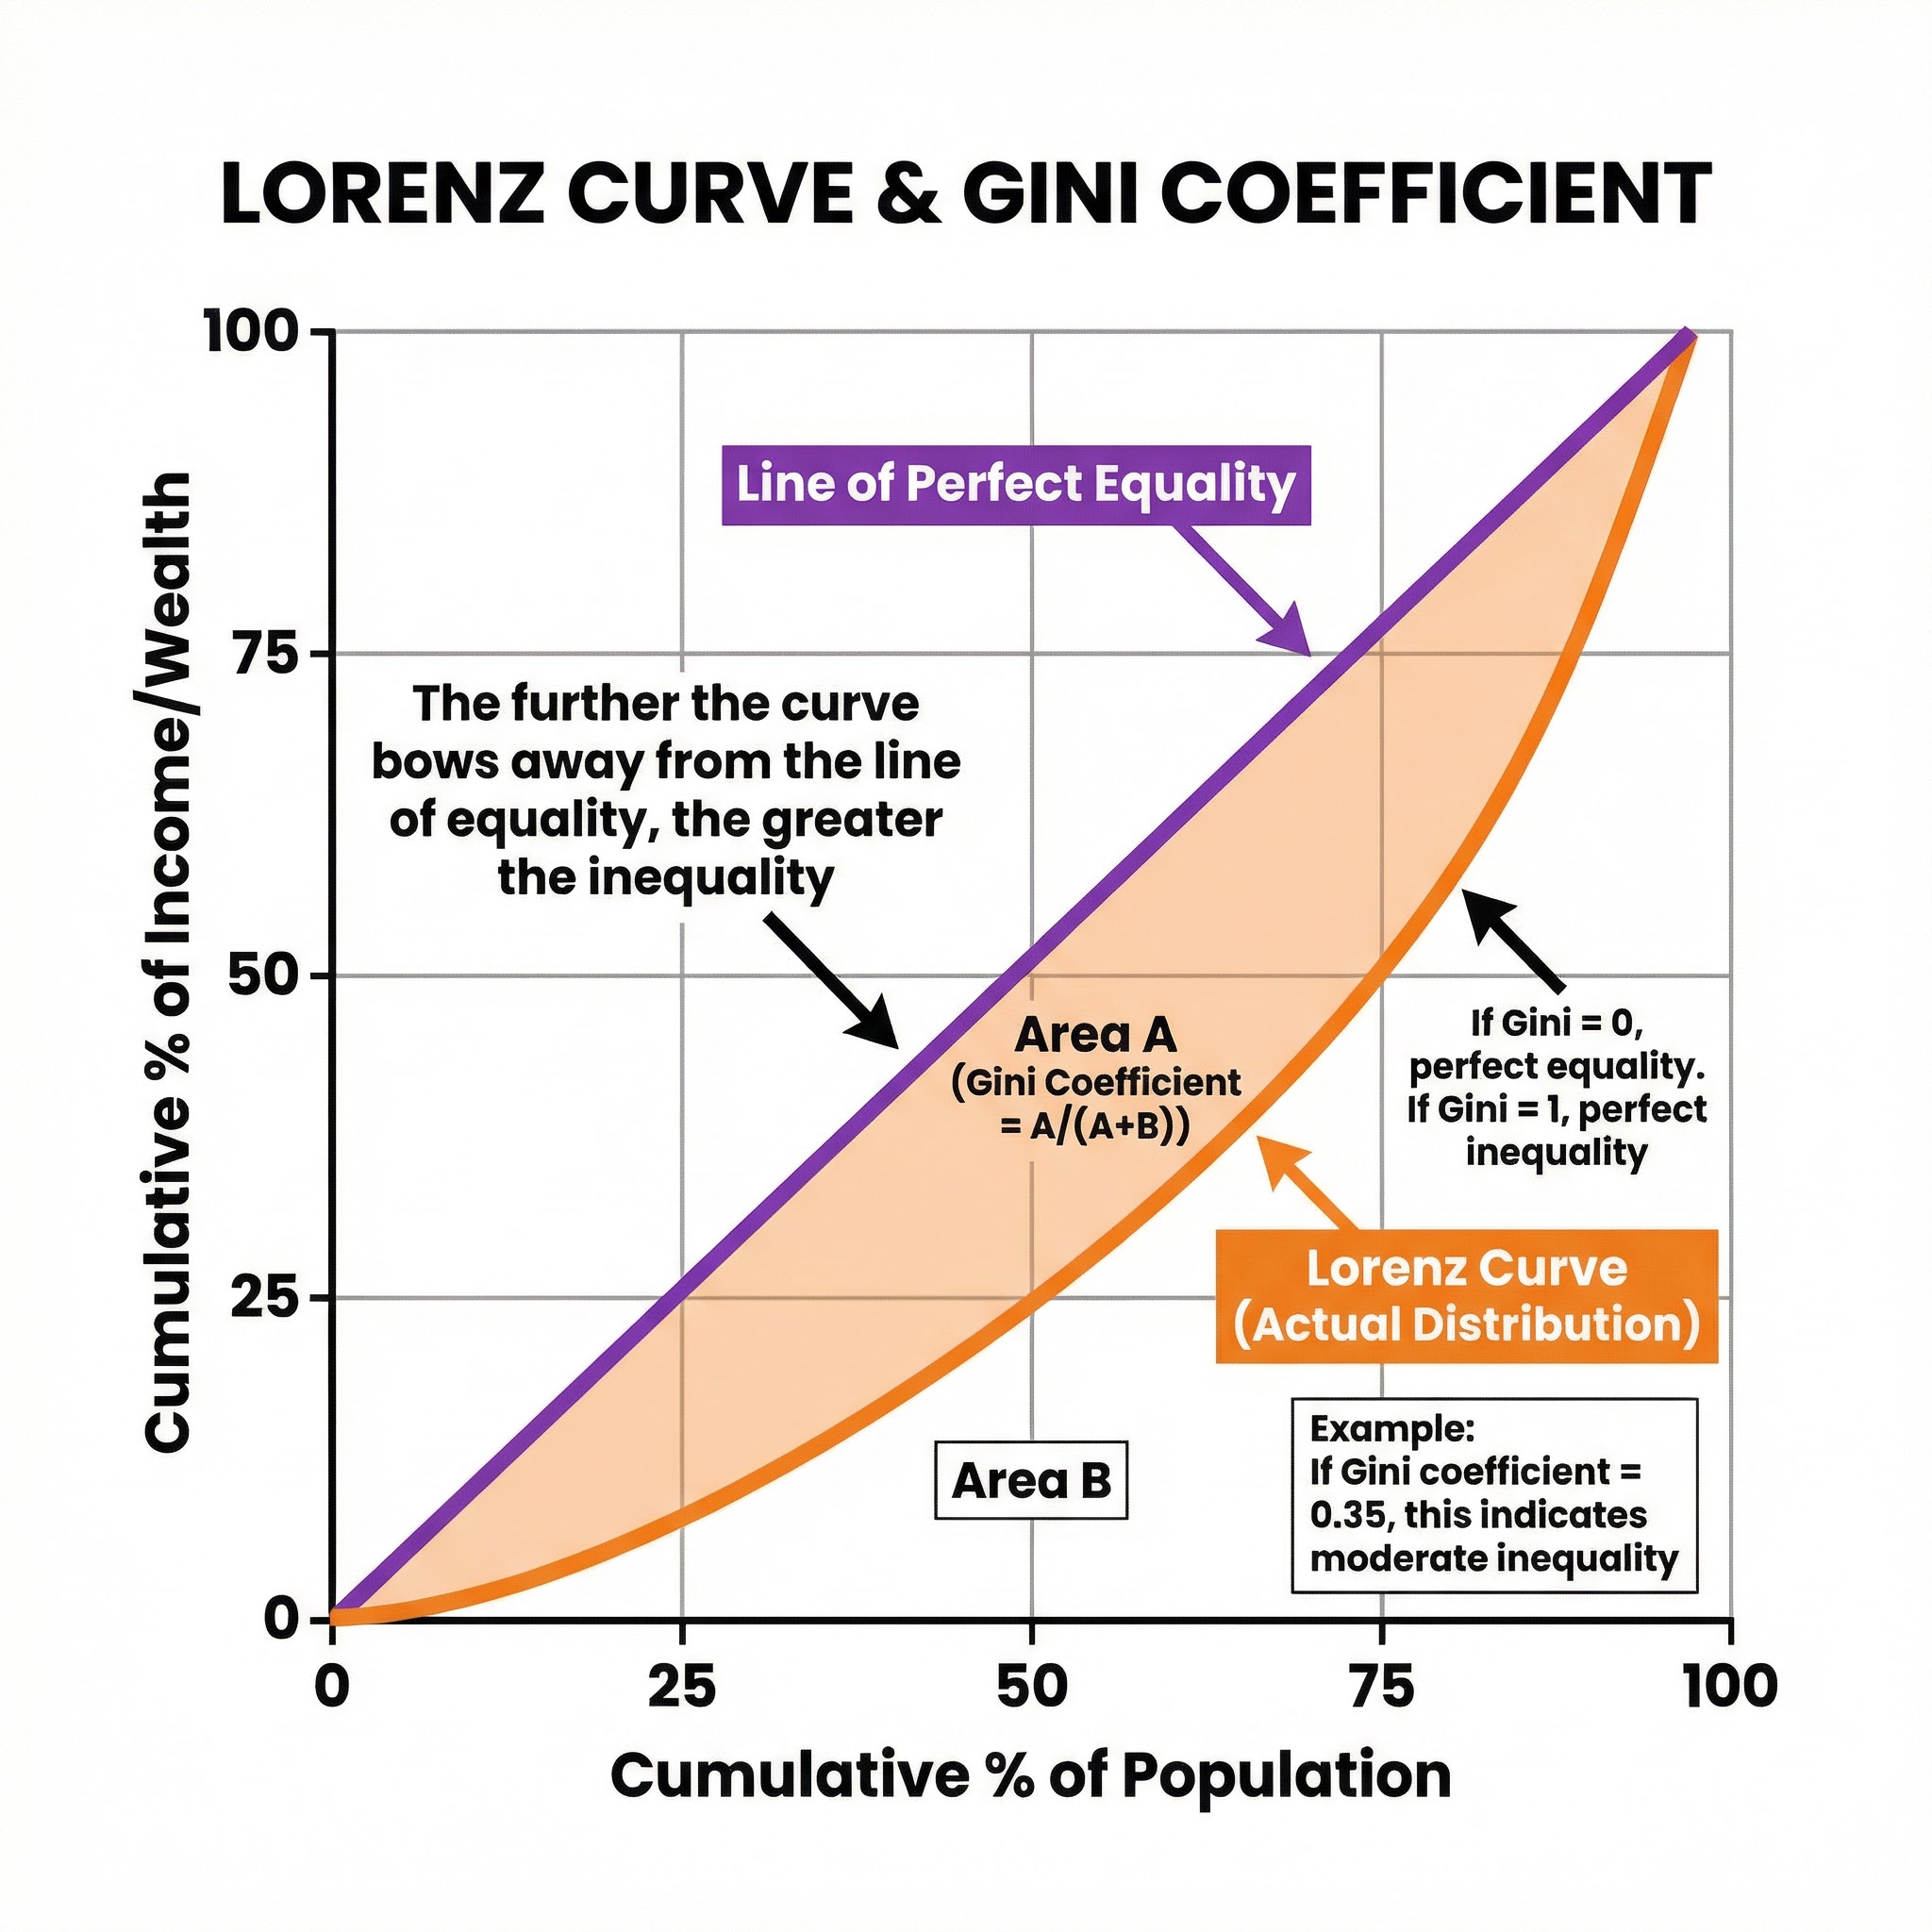
**The Lorenz Curve**: A graphical representation of income or wealth distribution. It plots the cumulative percentage of the population against the cumulative percentage of total income they receive. A straight diagonal line represents perfect equality, where every X% of the population receives X% of the income. The actual distribution is shown by a curved line (the Lorenz curve) that bows away from this line. **The further the curve bows out, the greater the degree of inequality.**
**The Gini Coefficient**: A numerical measure of inequality derived from the Lorenz curve. It is calculated as the ratio of the area between the line of perfect equality and the Lorenz curve (Area A) to the total area under the line of perfect equality (Area A + Area B).
- A Gini coefficient of **0** represents **perfect equality**.
- A Gini coefficient of **1** represents **perfect inequality** (where one person has all the income).
## Government Policies to Reduce Poverty & Inequality
Governments use a range of policies to redistribute income and reduce poverty. Candidates must be able to explain how these work and evaluate their effectiveness.
### Fiscal Policy (Taxation and Spending)
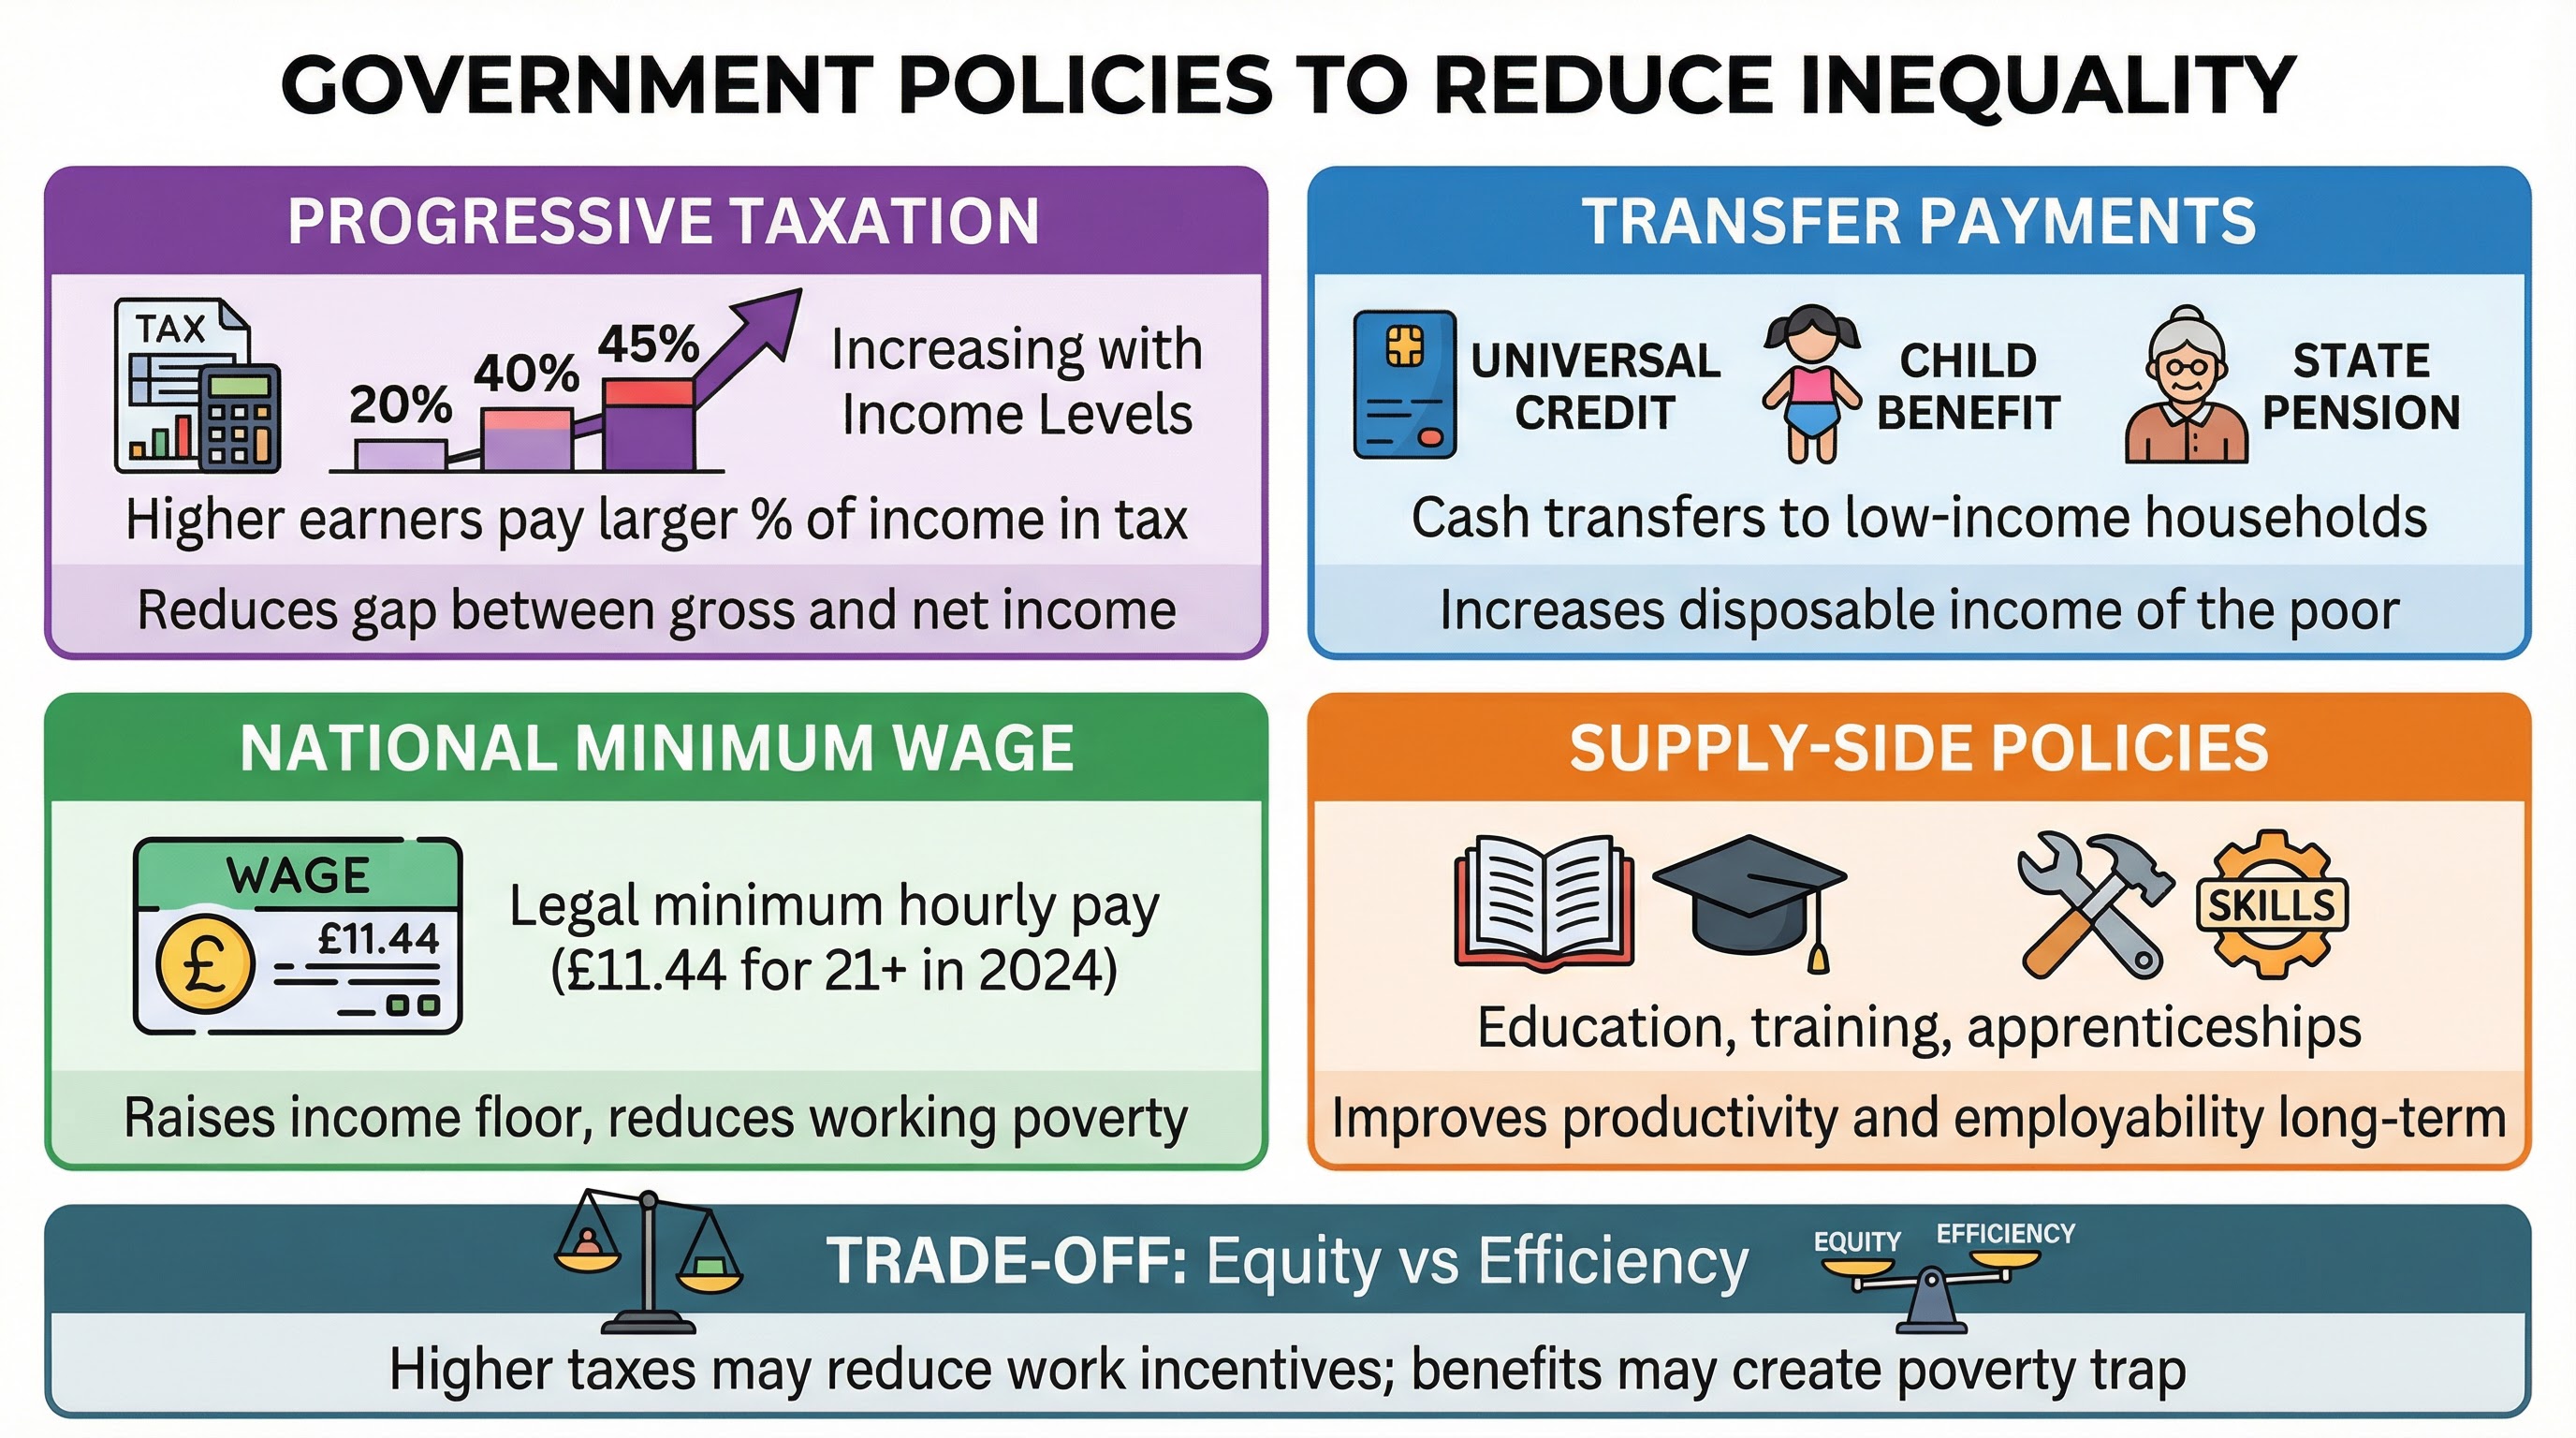
1. **Progressive Taxation**: A tax system where the tax rate increases as income increases. Higher earners pay a larger proportion of their income in tax. This reduces the gap between gross and post-tax income, thereby narrowing inequality.
2. **Transfer Payments (Welfare Benefits)**: Payments made by the government to individuals, for which no goods or services are received in return. Examples include Universal Credit, Child Benefit, and the State Pension. These directly increase the disposable income of the poorest households.
### Supply-Side Policies
These policies aim to improve the long-term productive potential of the economy and individuals.
1. **Education and Training**: Government spending on education and skills training improves the human capital of the workforce. This increases the productivity and earning potential of low-skilled workers, helping them to escape poverty permanently.
2. **National Minimum Wage (NMW)**: A legally enforced minimum hourly wage rate. This acts as a price floor in the labour market, raising the incomes of the lowest-paid workers. In the UK, for those aged 21 and over, this is known as the National Living Wage (£11.44 per hour as of April 2024).
### Evaluation: The Equity vs. Efficiency Trade-Off
A key evaluation point is the potential trade-off between equity (fairness) and efficiency.
- **High progressive taxes** might create a **disincentive to work** harder or seek promotion, potentially slowing economic growth.
- **Generous welfare benefits** could create a **poverty trap**, where individuals are better off on benefits than in low-paid work. This can lead to a dependency culture and reduce the labour supply.