Supply and Factors Influencing Supply — OCR GCSE Study Guide
Exam Board: OCR | Level: GCSE
This study guide provides a comprehensive overview of the concept of supply in OCR GCSE Economics (J205). It focuses on the critical distinction between movements along the supply curve and shifts in the curve, equipping students with the knowledge to analyse how producers make decisions and to secure high marks in the exam.
## Overview
Supply is a cornerstone of microeconomic analysis, representing the producer side of the market. For the OCR GCSE Economics exam, candidates must demonstrate a precise understanding of what supply is, the law of supply, and, most importantly, the factors that cause supply to change. Examiners are looking for a clear distinction between a change in price, which causes a movement along the supply curve, and a change in a non-price factor, which causes the entire curve to shift. This guide will break down these concepts, providing the detailed chains of reasoning and diagrammatic analysis required for top-level credit. Mastery of this topic is essential for understanding how markets function, how firms respond to changing costs, and the impact of government interventions like taxes and subsidies.

## The Law of Supply
The fundamental principle of supply is the **Law of Supply**, which states that there is a positive relationship between the price of a good and the quantity supplied. As the price of a good rises, producers are more willing and able to supply more of it. This is because higher prices typically lead to higher potential profits, creating a powerful incentive to increase production. Conversely, if the price falls, the incentive to produce is reduced, and the quantity supplied will decrease. This relationship is why the supply curve is always drawn sloping upwards from left to right.
## Movement vs. Shift
A critical distinction for any economics candidate is the difference between a movement along the supply curve and a shift of the supply curve. Getting this wrong is a common source of lost marks.
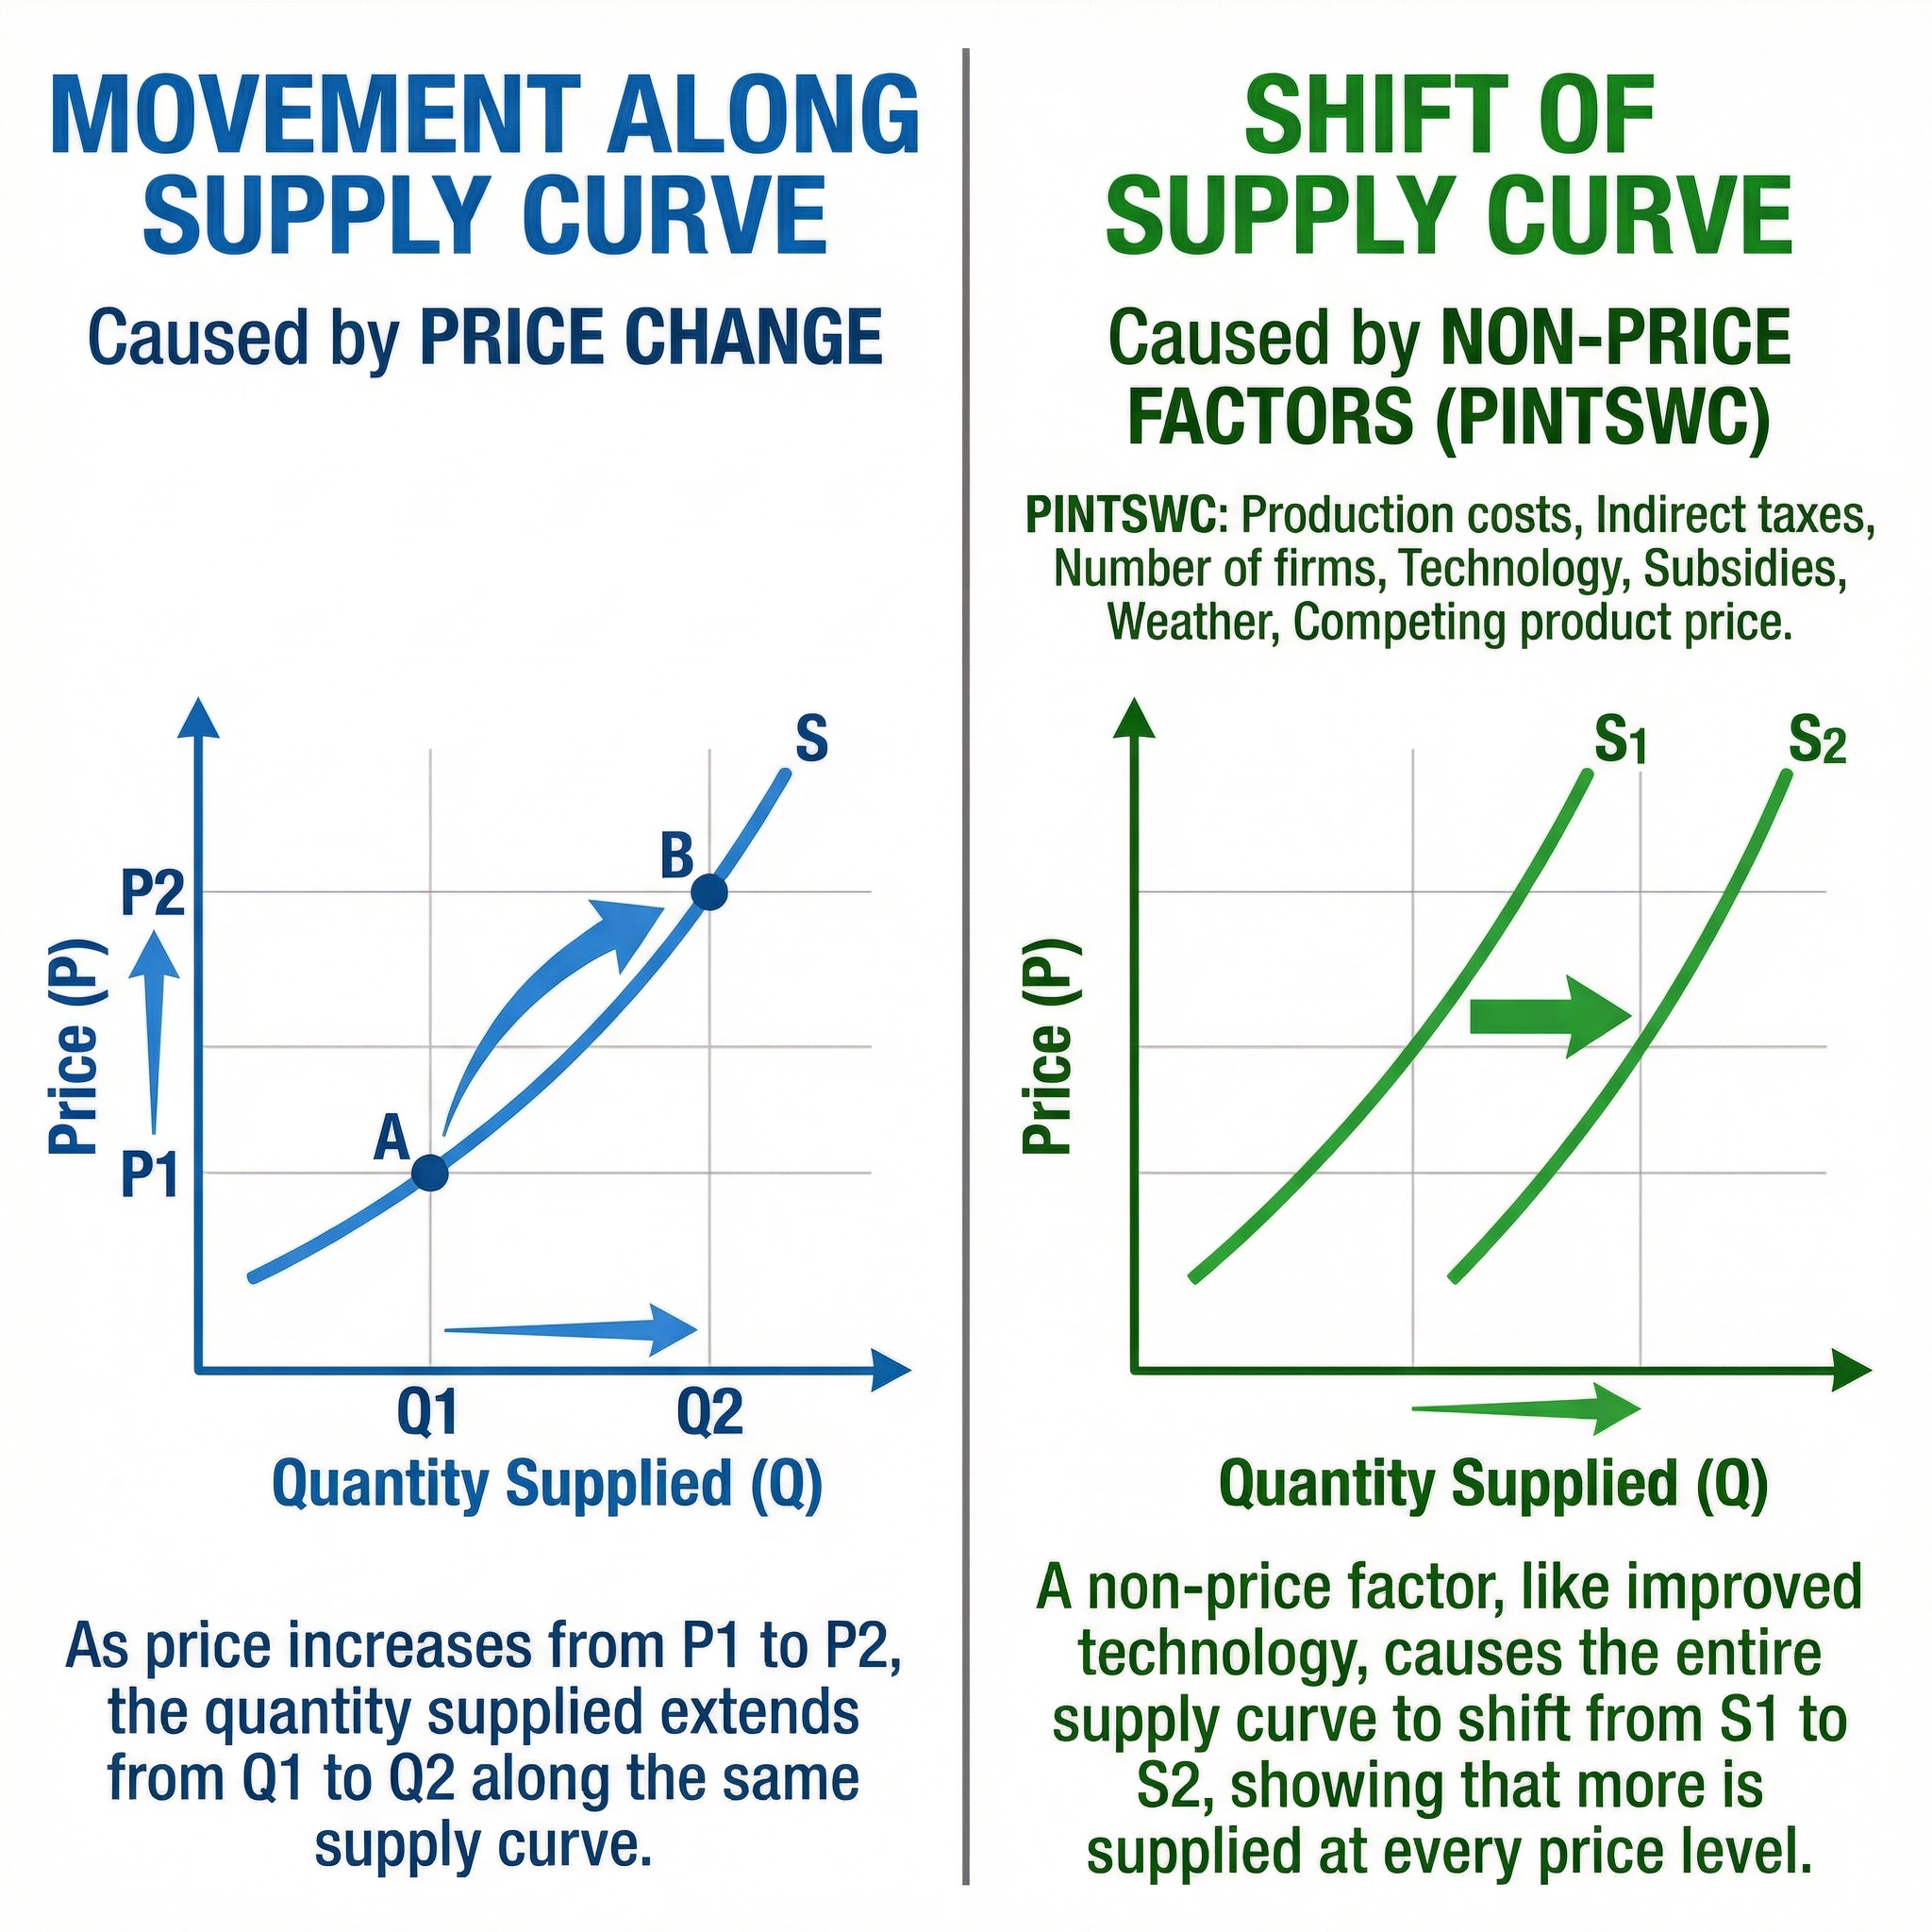
### Movement Along the Supply Curve
* **Cause**: A change in the price of the good itself, and nothing else.
* **Effect**: The producer moves to a different point along the *existing* supply curve.
* **Example**: If the market price for wheat increases, a farmer will supply more wheat. This is shown as an upward movement along the supply curve.
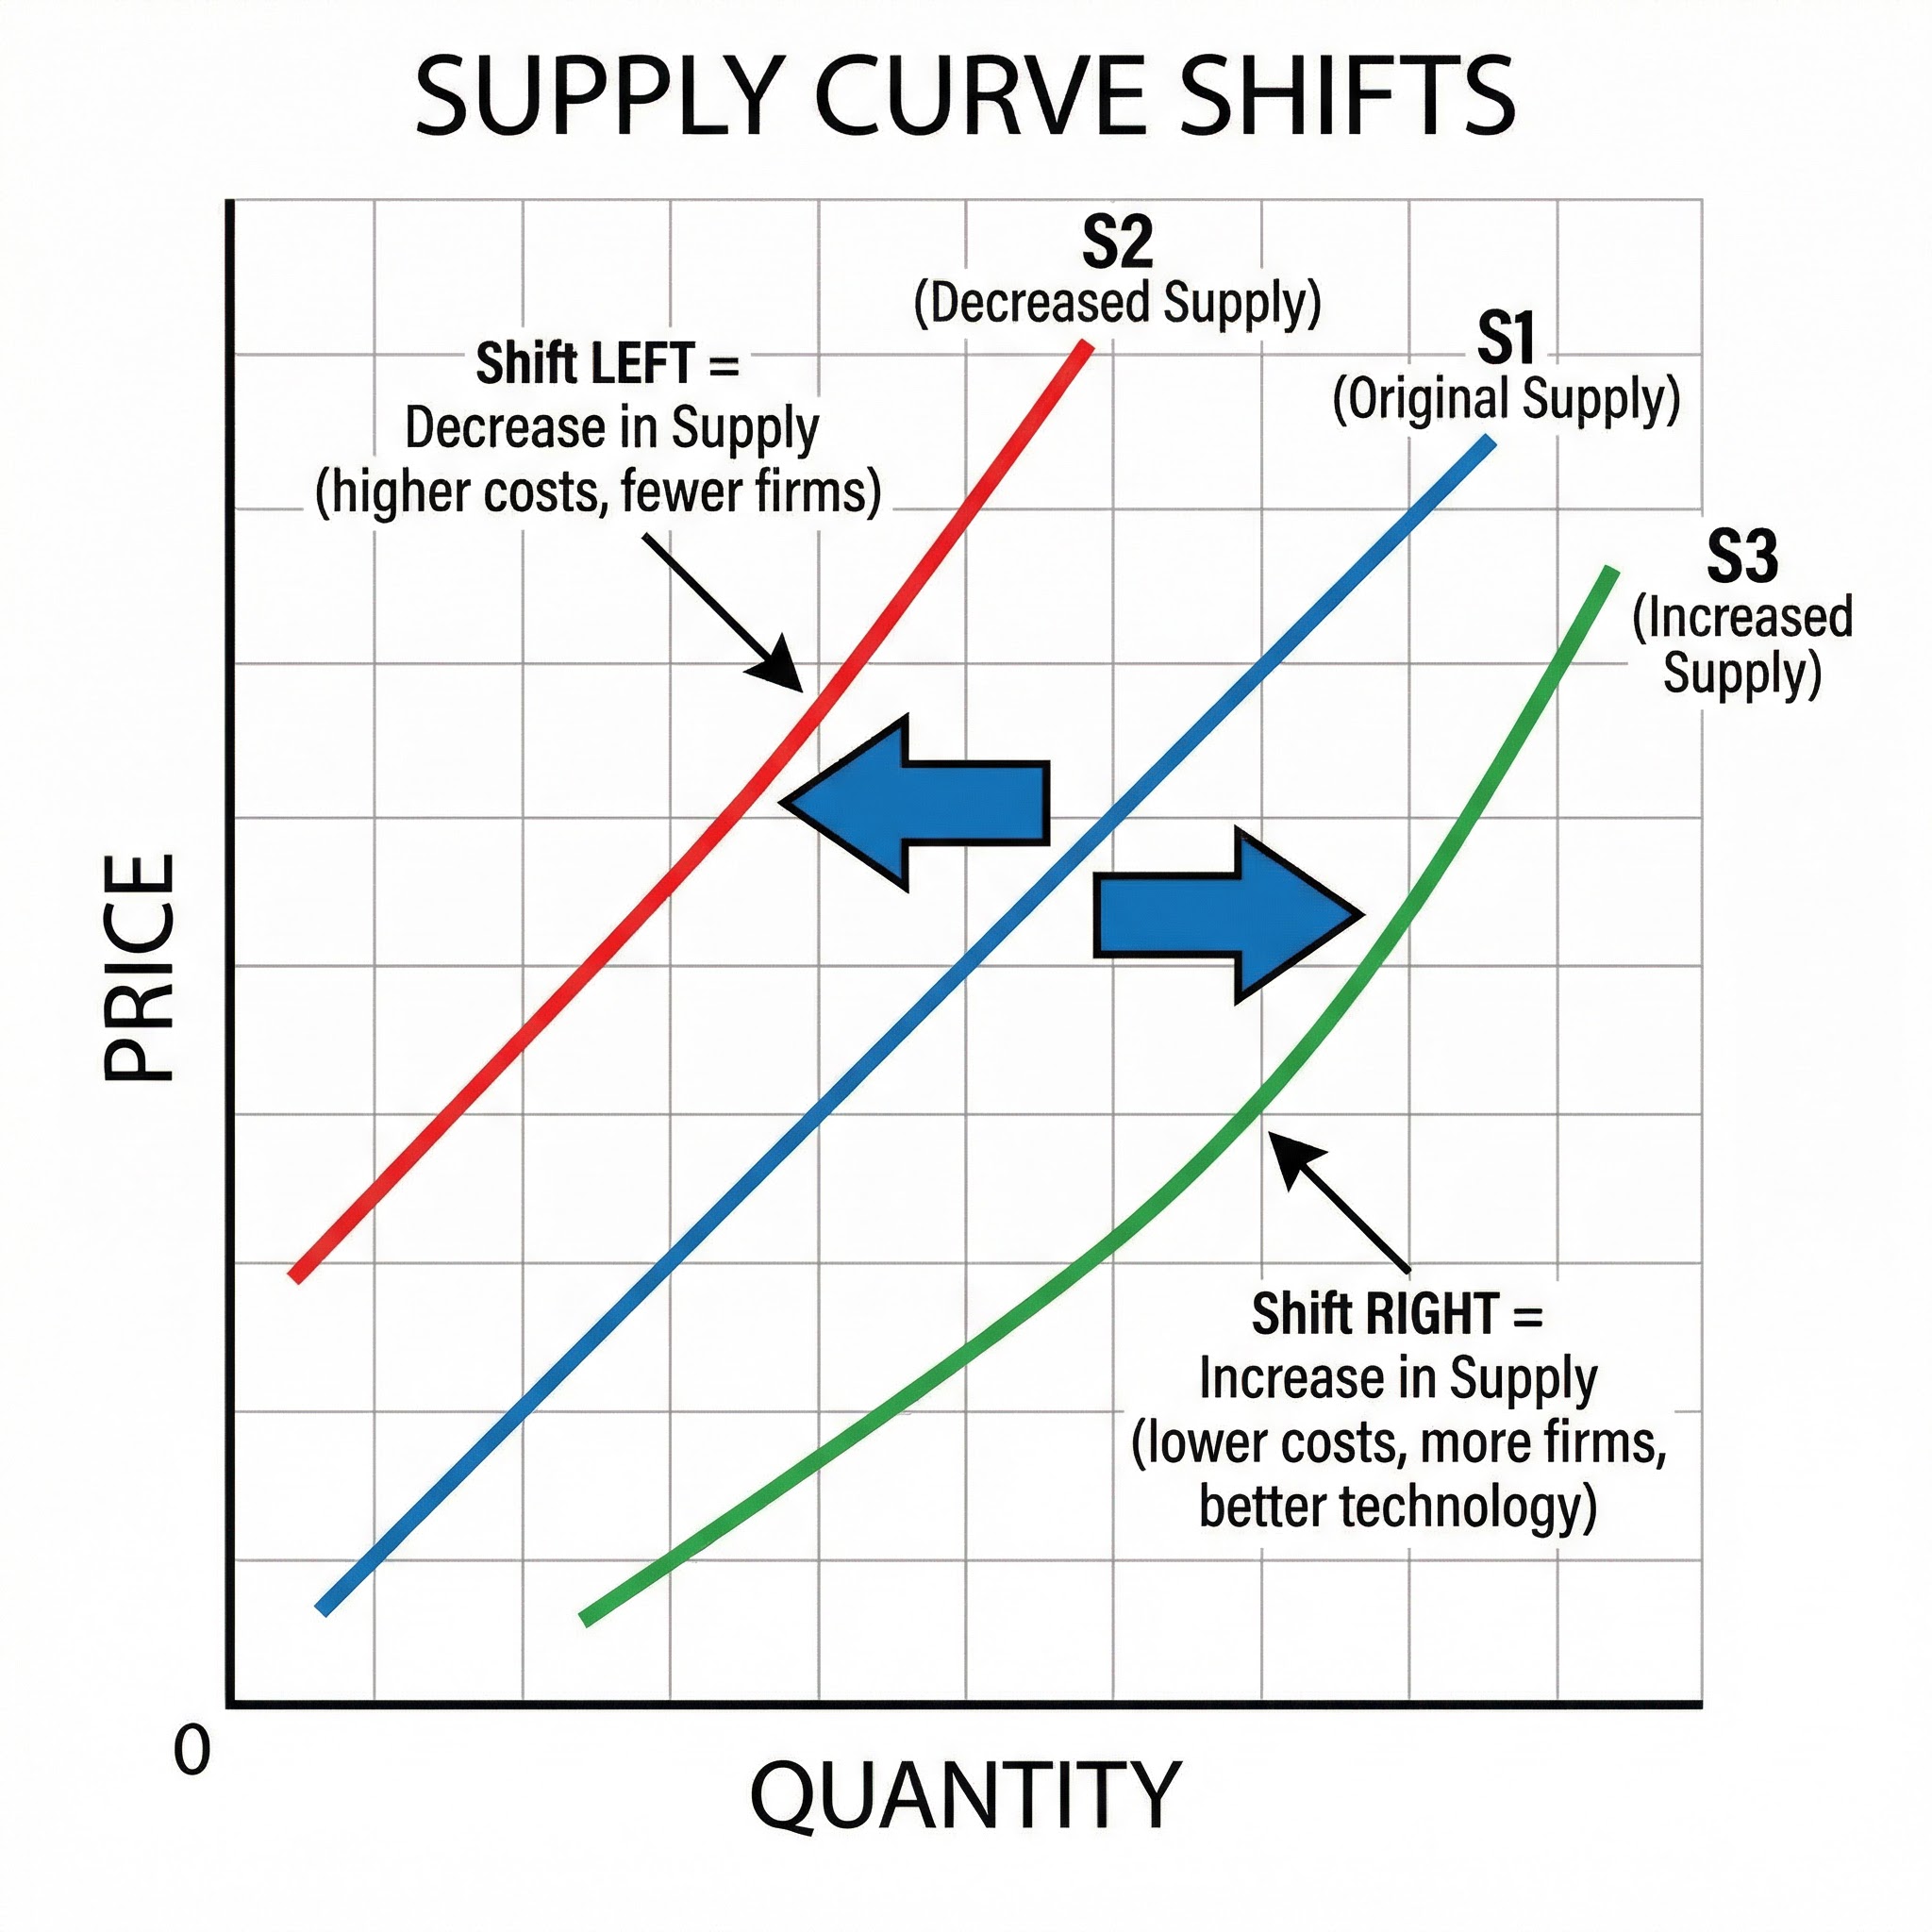
### Shift of the Supply Curve
* **Cause**: A change in any non-price factor that affects the conditions of production.
* **Effect**: The entire supply curve moves to a new position. A shift to the right indicates an increase in supply, while a shift to the left indicates a decrease in supply.
* **Example**: If the government provides a subsidy to wheat farmers, their costs fall, and they are willing to supply more wheat at *every* price level. This is shown as a rightward shift of the entire supply curve.
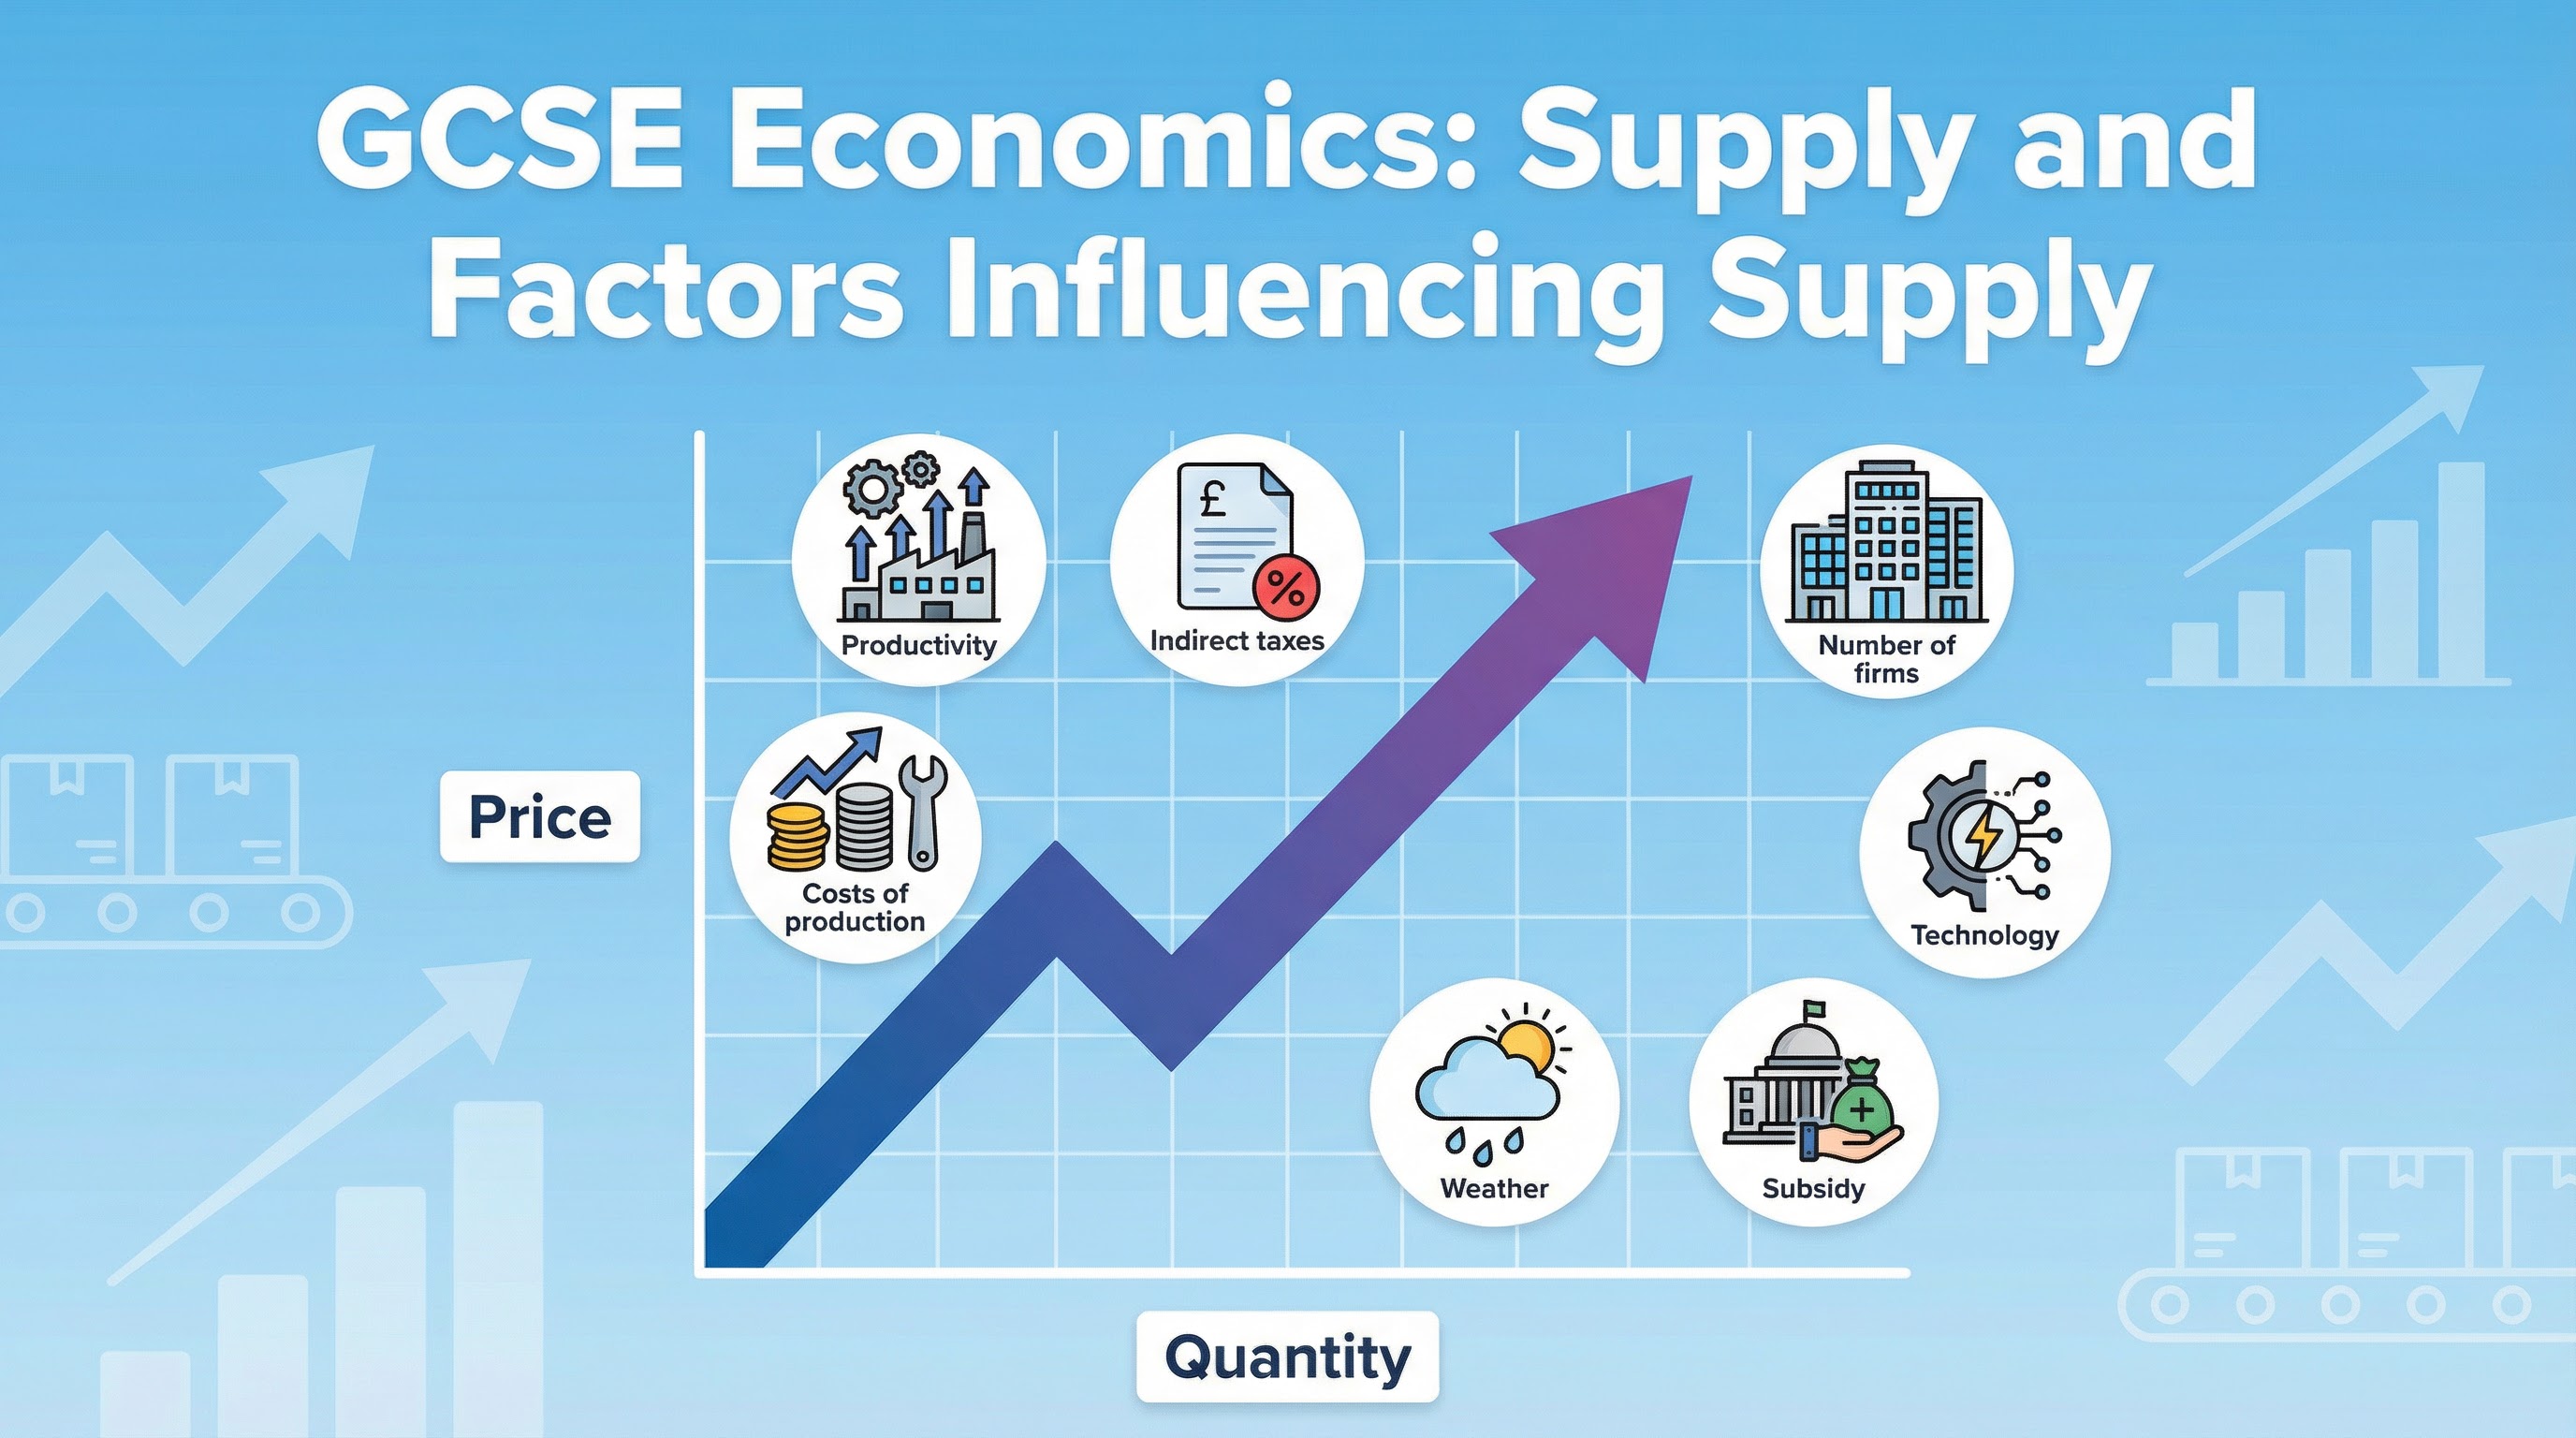
## Factors Shifting the Supply Curve (PINTSWC)
To remember the non-price factors that shift the supply curve, use the acronym **PINTSWC**. Examiners expect you to not only list these factors but also explain the logical chain of how they affect a firm's costs and, therefore, its willingness to supply.
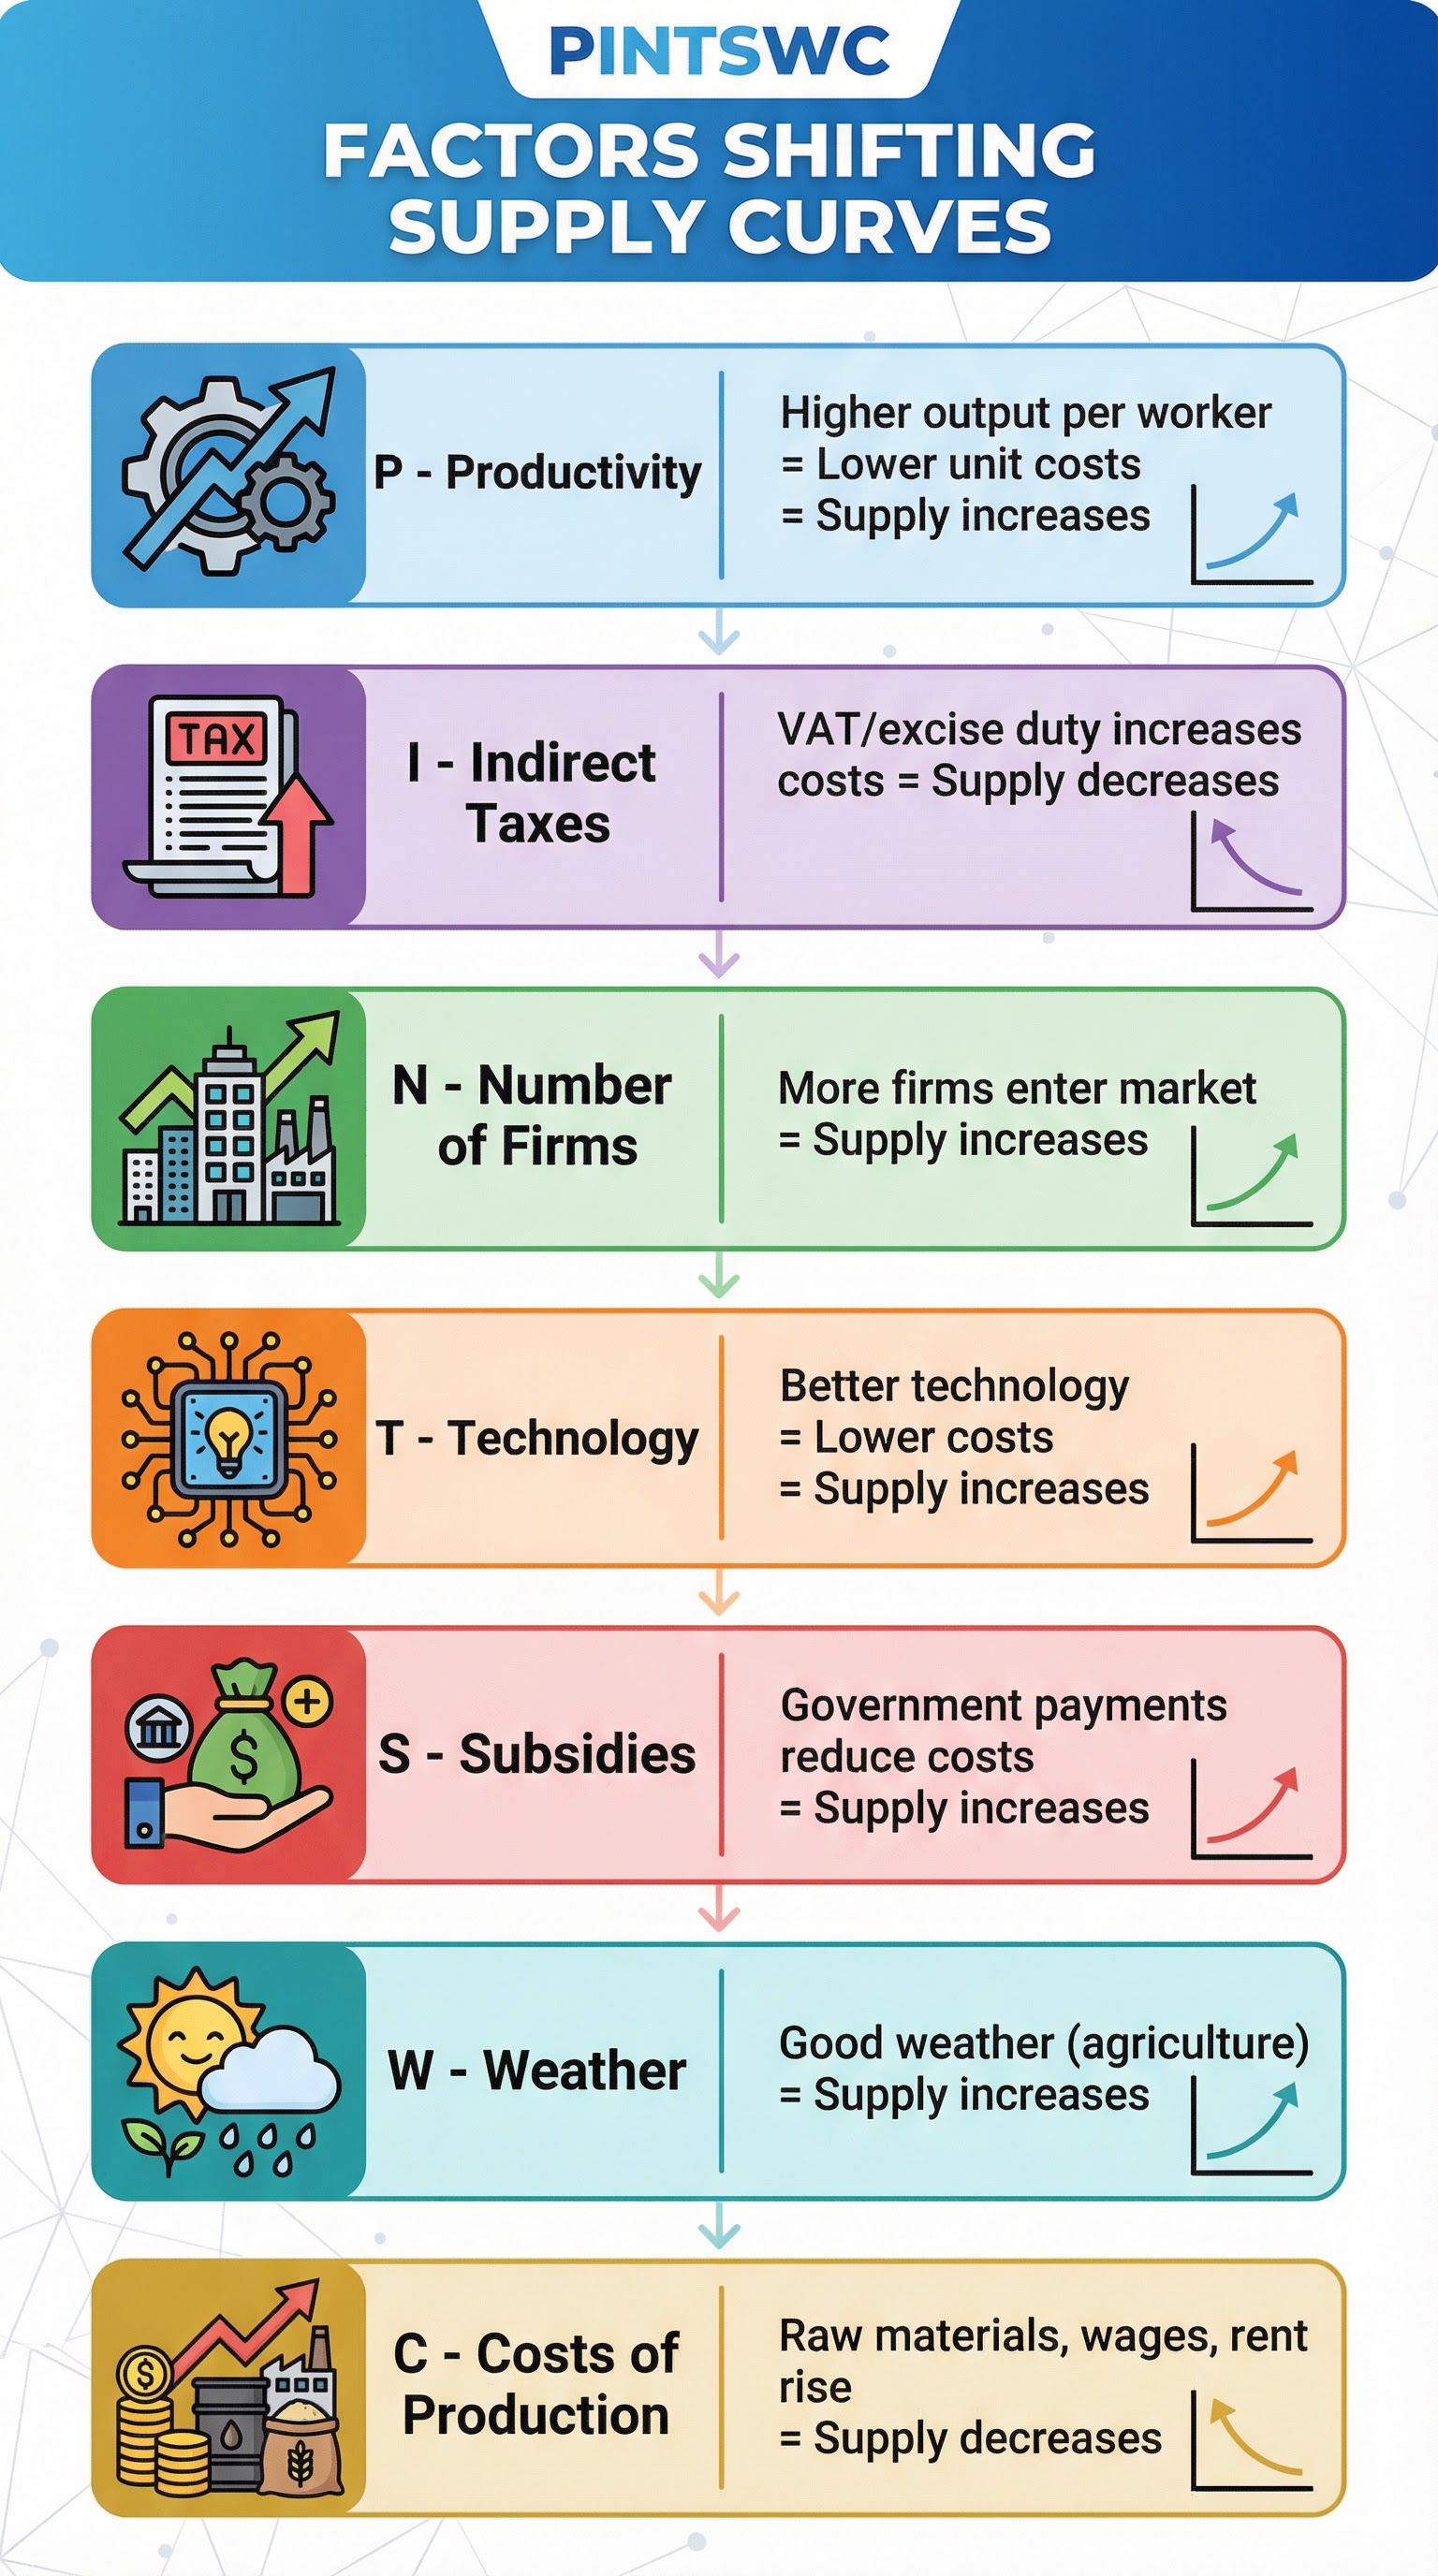
* **P - Productivity**: An increase in the productivity of labour or capital (e.g., through better training or more efficient machinery) means that the output per unit of input increases. This lowers the cost of production per unit, increasing profit margins and shifting the supply curve to the right.
* **I - Indirect Taxes**: These are taxes levied on goods and services, such as VAT. An indirect tax is treated as a cost of production by the firm. If the government increases the tax on a product, the firm's costs rise, profits are squeezed, and the supply curve shifts to the left.
* **N - Number of Firms**: If new firms enter an industry, the total market supply will increase at every price level. This causes the market supply curve to shift to the right. Conversely, if firms leave the market, supply will decrease, shifting the curve to the left.
* **T - Technology**: Advances in technology can dramatically reduce production costs. For example, a new robot on a car assembly line can work faster and more accurately than a human, lowering the cost per vehicle and shifting the supply curve to the right.
* **S - Subsidies**: A subsidy is a grant given by the government to a producer to encourage the production of a good. This payment effectively lowers the producer's costs. As a result, they are willing to supply more at every price, shifting the supply curve to the right.
* **W - Weather**: This is particularly significant in agricultural markets. Favourable weather conditions will lead to a good harvest, increasing the supply of crops and shifting the supply curve to the right. A flood or drought would decrease supply, shifting the curve to the left.
* **C - Costs of Production**: This is a broad category that includes wages, raw material prices, energy costs, and rent. If any of these costs rise, it becomes more expensive to produce the good, reducing profitability and causing the supply curve to shift to the left. A fall in these costs would shift it to the right.