Probability — OCR A-Level Study Guide
Exam Board: OCR | Level: A-Level
Master OCR A-Level Probability by mastering set notation, conditional probability, and the art of proof. This guide breaks down complex concepts into manageable steps, showing you how to secure every mark by thinking like an examiner and avoiding common pitfalls."
## Overview
Probability (OCR specification 4.2) is a cornerstone of A-Level Mathematics, focusing on quantifying uncertainty and modelling real-world scenarios. It moves beyond simple chance, demanding a rigorous application of set theory, logical reasoning, and algebraic proof. For examiners, this topic is a powerful tool to assess a candidate's ability to deconstruct complex, wordy problems, apply precise mathematical language, and justify their conclusions—key skills for higher-level mathematics. Typical exam questions involve interpreting scenarios, calculating probabilities from Venn diagrams, tree diagrams, or two-way tables, and formally proving whether events are statistically independent. Mastering this topic is not just about learning formulas; it’s about developing a structured way of thinking that connects abstract concepts to practical outcomes, a skill highly valued in STEM fields and beyond.

## Key Concepts
### Concept 1: Set Notation and Venn Diagrams
At its heart, probability is the study of sets. A **set** is a collection of outcomes, and an **event** is a specific set of outcomes we are interested in. OCR places a heavy emphasis on using correct notation to describe these sets.
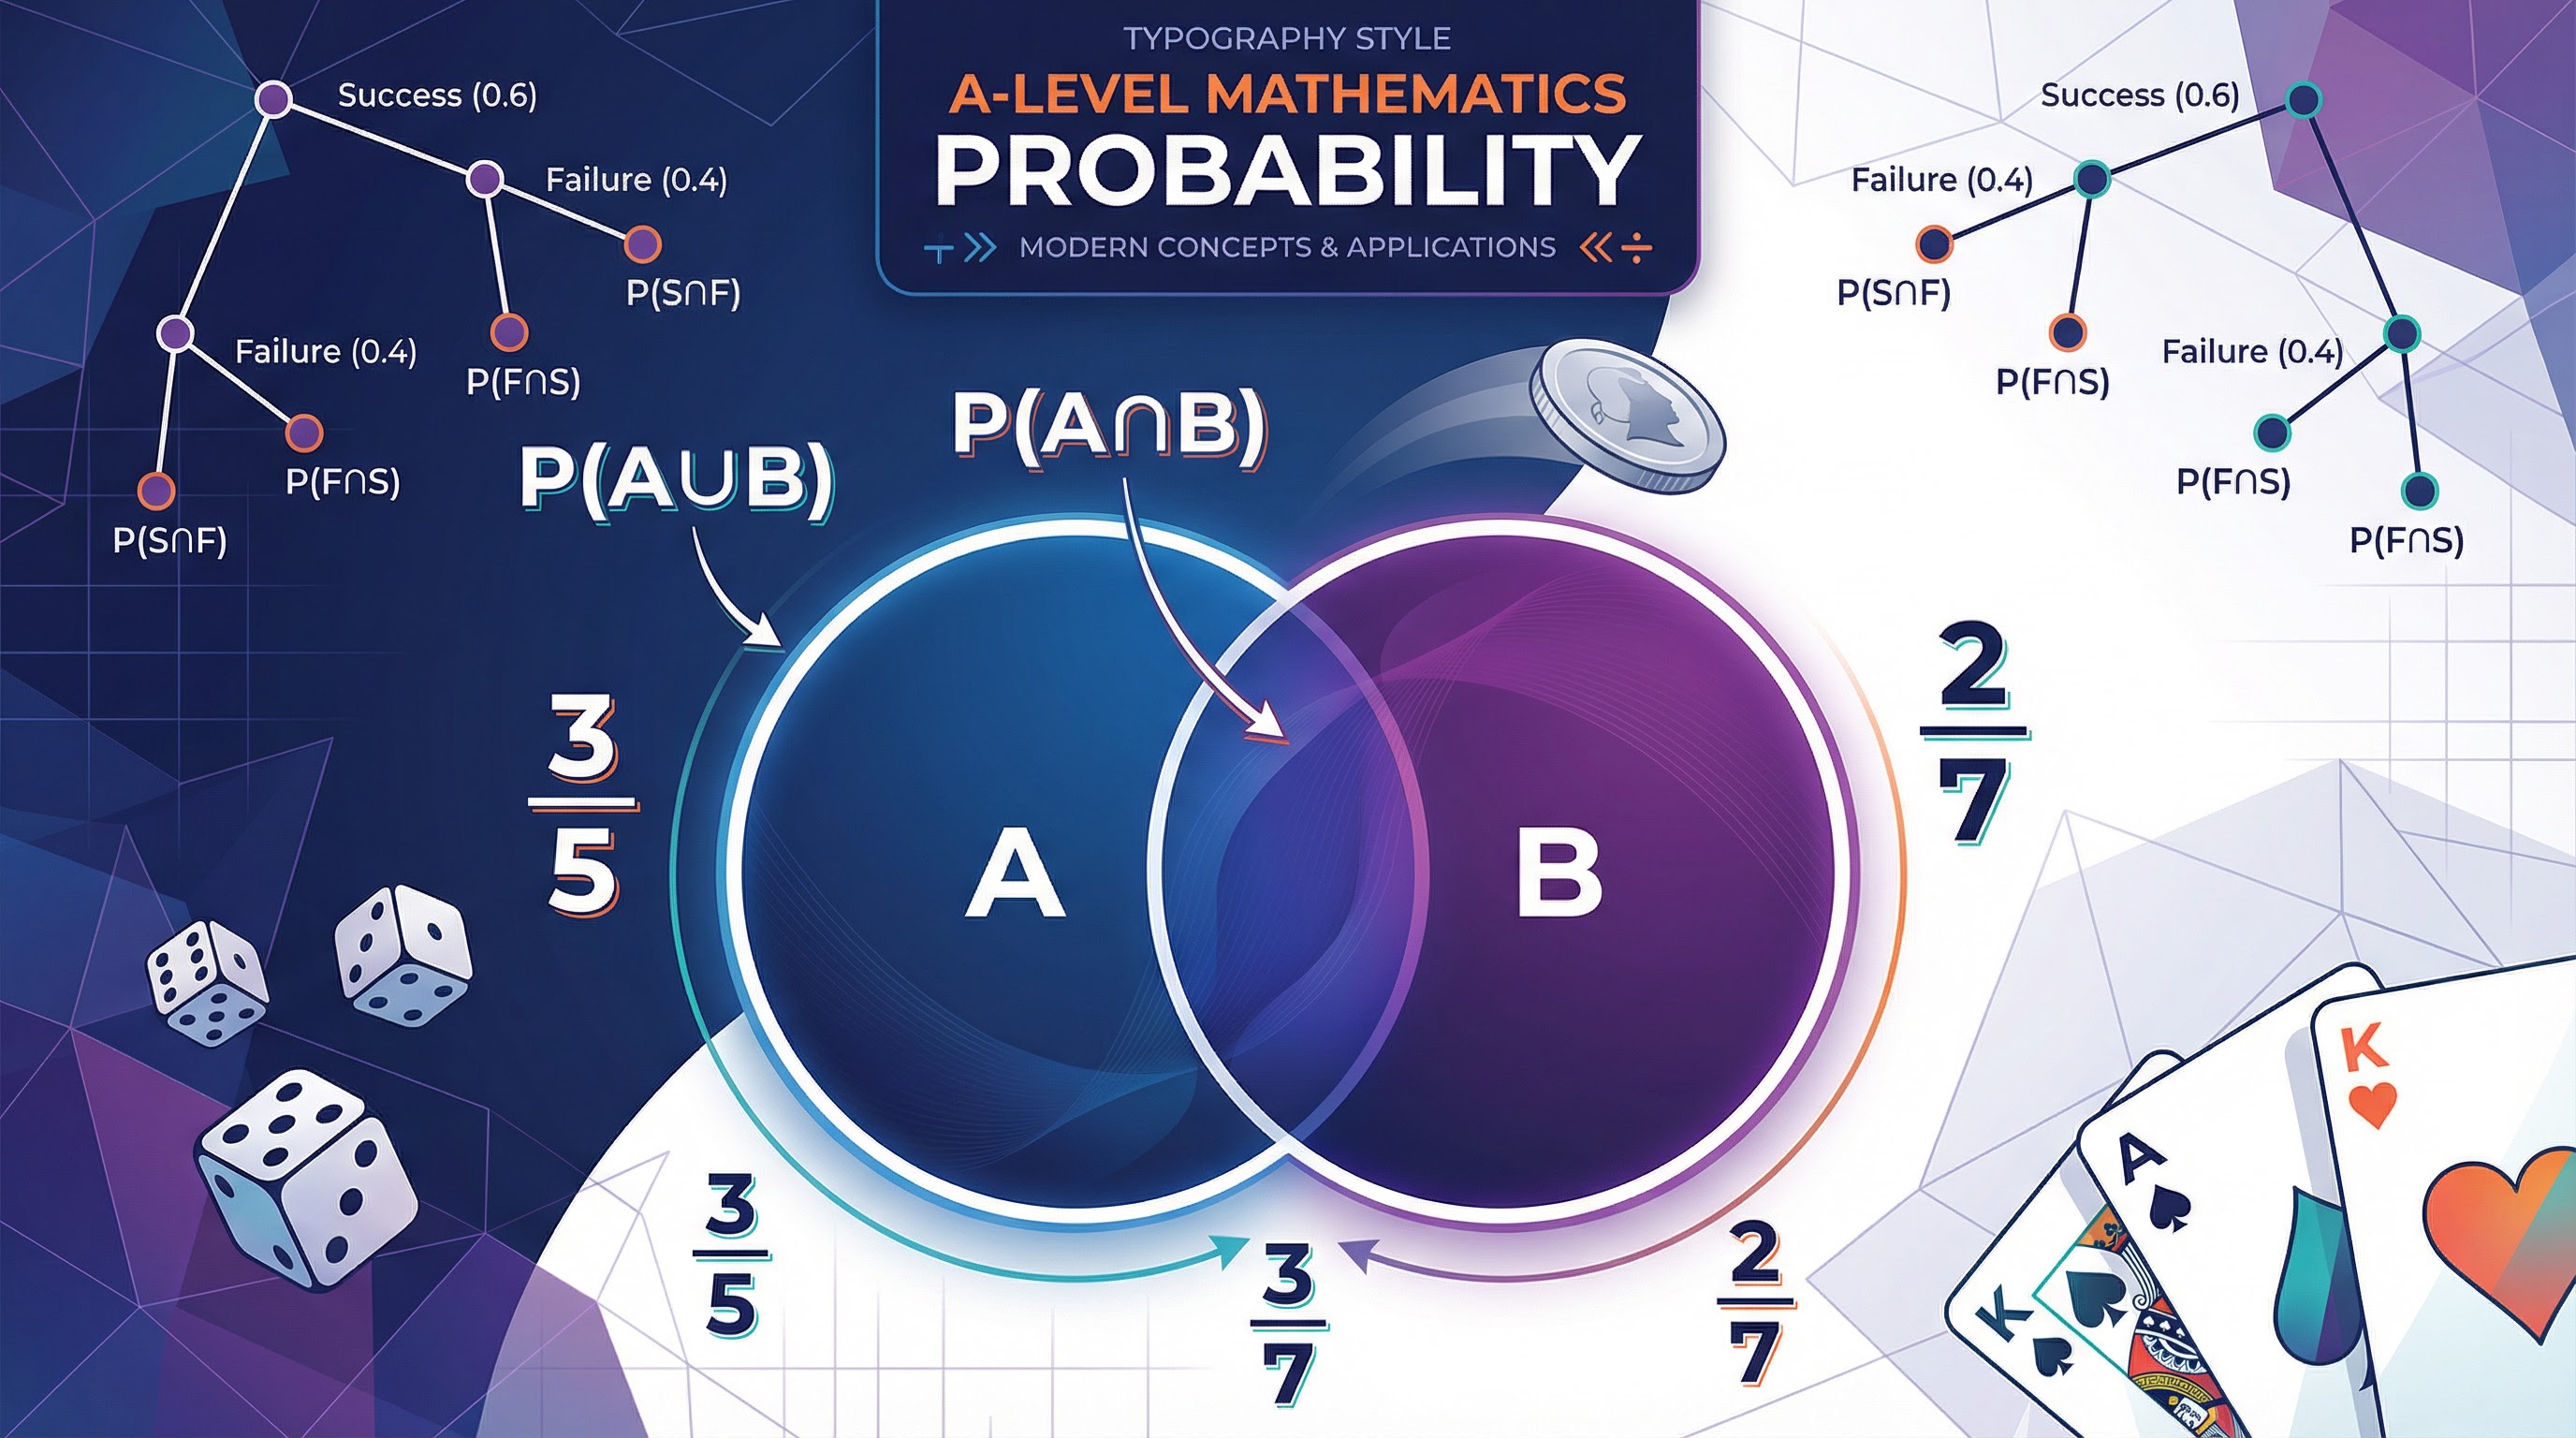
- **Union (A ∪ B)**: Represents event A **OR** event B (or both) occurring. Think of it as the total area covered by both circles in a Venn diagram.
- **Intersection (A ∩ B)**: Represents event A **AND** event B occurring simultaneously. This is the overlapping section of the circles.
- **Complement (A')**: Represents event A **NOT** occurring. This is everything in the sample space outside of circle A.
**Venn diagrams** are your most powerful tool for visualizing these relationships. A correctly drawn Venn diagram, where all probabilities (including the region outside the circles) sum to 1, can earn direct marks (B1) and is essential for solving conditional probability problems.
### Concept 2: Conditional Probability
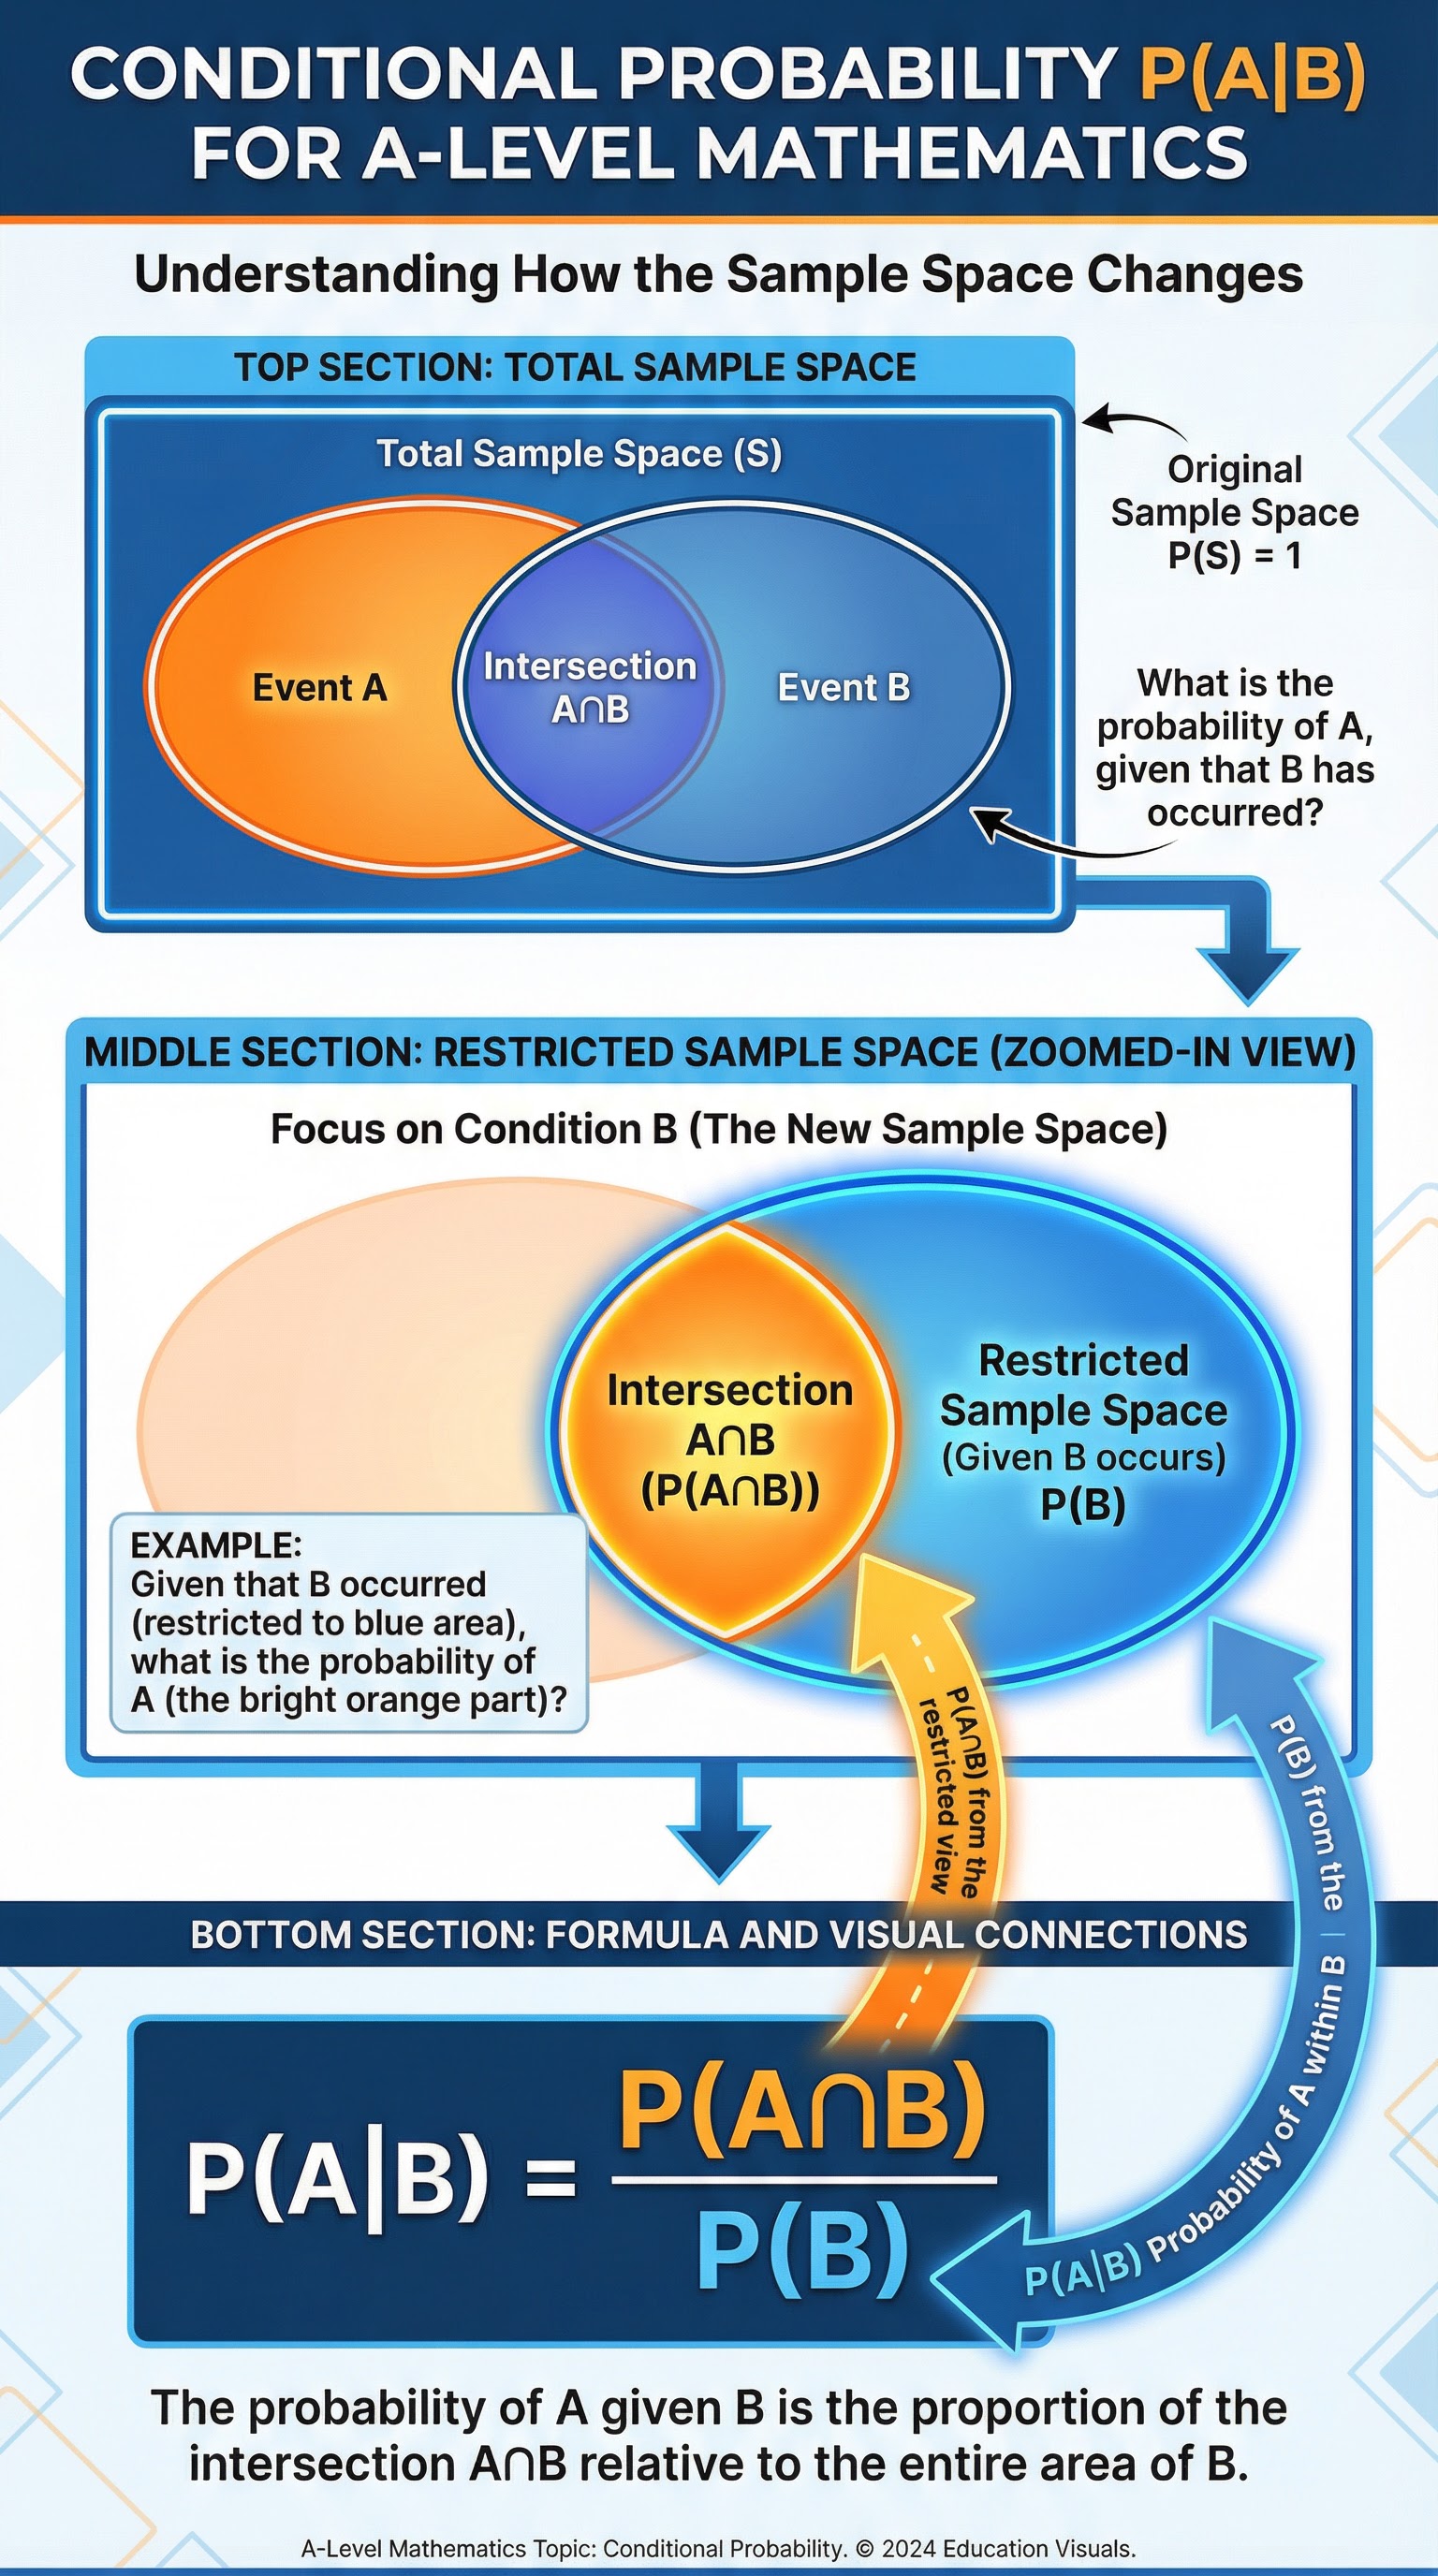
This is arguably the most challenging area for many candidates. **Conditional probability** deals with situations where we have extra information. It answers the question: "What is the probability of event A happening, **given that** we know event B has already happened?"
The command word is **"given that"**. This is a signal to restrict your sample space. You are no longer considering all possible outcomes; you are living in a world where event B is a certainty. The denominator of your probability calculation is no longer the total probability (1), but the probability of the condition, P(B).
**Example**: Imagine a school where 30% of students study both Physics (P) and Chemistry (C), and 50% of students study Physics. If you pick a student at random and they study Physics, what is the probability they also study Chemistry? You are "given that" they study Physics, so your world is now just the 50% of students who do Physics. The proportion of those who *also* do Chemistry is the 30% intersection. The probability is the intersection divided by the condition.
### Concept 3: Independence vs. Mutual Exclusivity
Students frequently confuse these two terms, a mistake that can be costly.
- **Mutually Exclusive Events**: Cannot happen at the same time. The occurrence of one event entirely prevents the other. On a Venn diagram, their circles do not overlap. Therefore, **P(A ∩ B) = 0**. Example: A student cannot be in both Year 12 and Year 13.
- **Independent Events**: The occurrence of one event has no effect on the probability of the other. Example: Rolling a six on a die and flipping a head on a coin. For a question asking you to **"Show that"** or **"Prove"** independence, you MUST perform the mathematical test.
## Mathematical/Scientific Relationships
Here are the core formulas you will be tested on. It is crucial to know which are provided and which must be memorised.
1. **The Addition Rule (General)**
- `P(A ∪ B) = P(A) + P(B) - P(A ∩ B)`
- **Status**: Must memorise.
- **Use when**: Finding the probability of A *or* B, especially when events are not mutually exclusive. Examiners award an M1 mark for stating this formula correctly.
2. **The Addition Rule (for Mutually Exclusive Events)**
- `P(A ∪ B) = P(A) + P(B)`
- **Status**: Derived from the general rule (since P(A ∩ B) = 0).
- **Use when**: You know for certain the events cannot happen together.
3. **The Conditional Probability Formula**
- `P(A|B) = P(A ∩ B) / P(B)`
- **Status**: Given on formula sheet.
- **Use when**: You see the phrase "given that", "if", or are asked to find a probability based on a known condition.
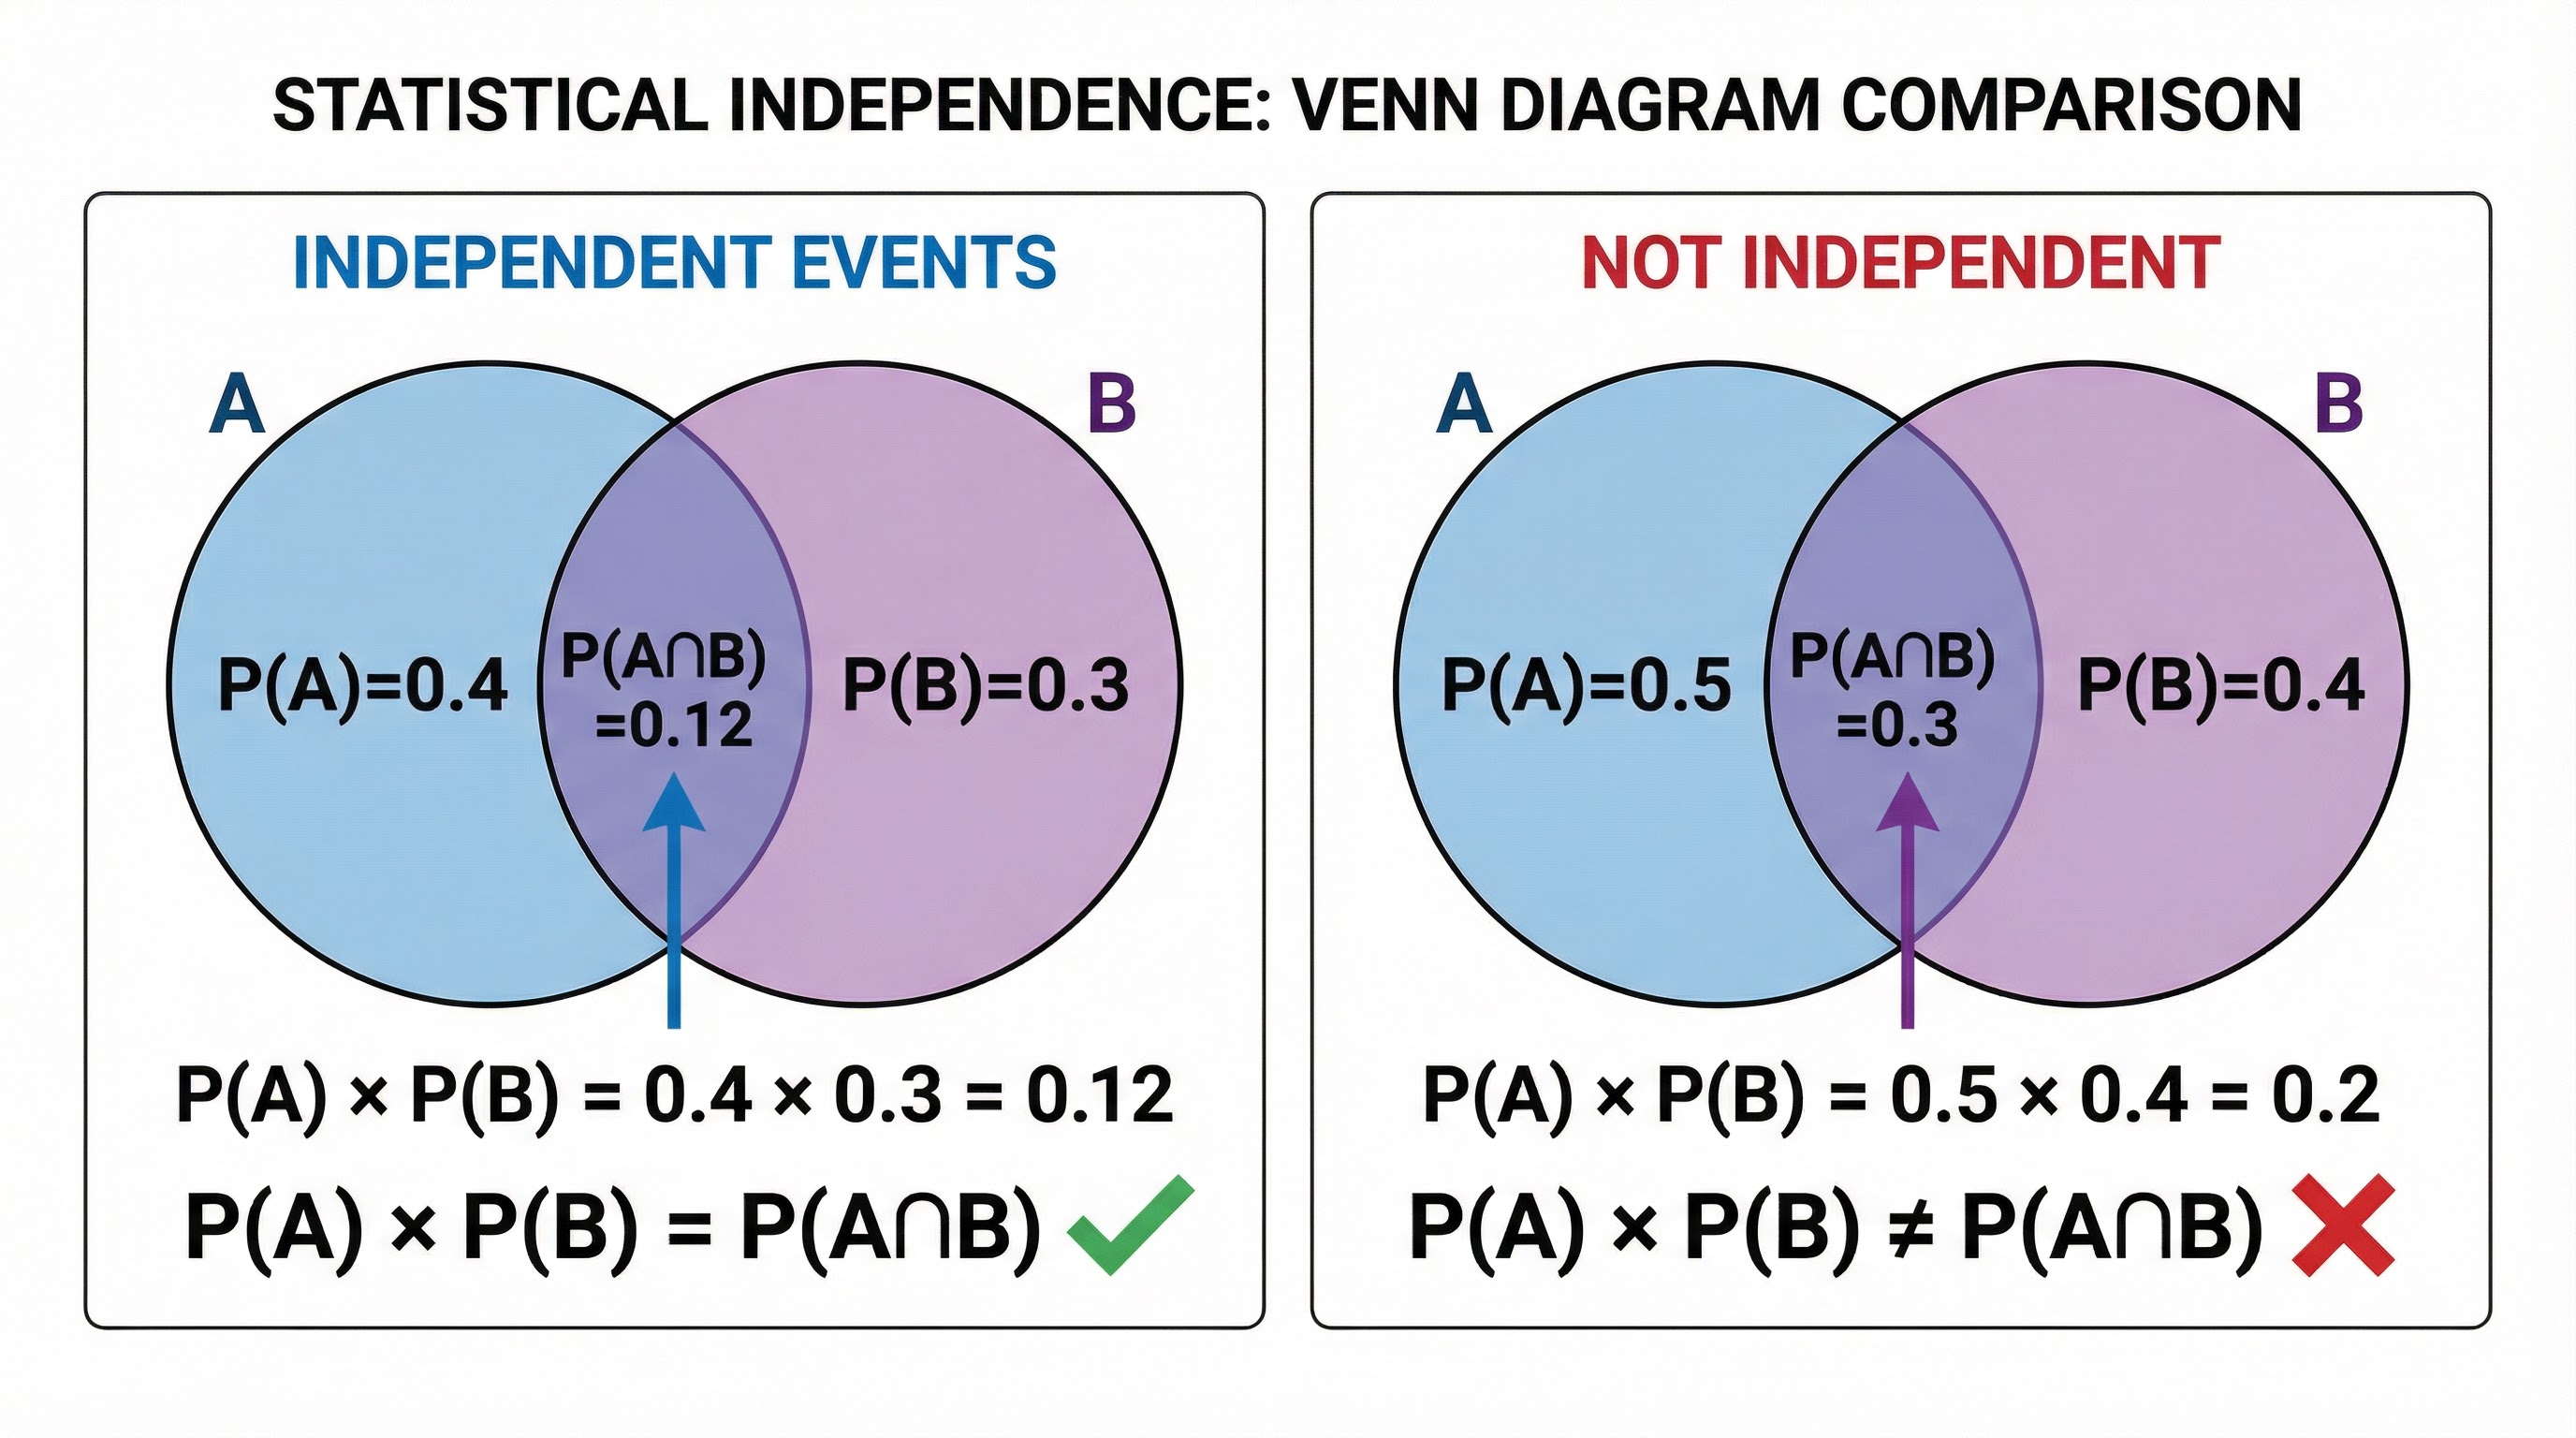
4. **The Independence Test**
- Events A and B are independent if and only if `P(A ∩ B) = P(A) × P(B)`
- **Status**: Must memorise.
- **Use when**: Asked to "determine", "show", or "prove" that two events are independent. You must show the calculation for both sides of the equation and make a concluding statement.
## Practical Applications
Probability is not just an abstract topic; it is the mathematical engine behind many real-world industries:
- **Insurance**: Actuaries use conditional probability and historical data to calculate the likelihood of events like car accidents or house fires, given factors like age, location, and driving history. This determines the price of insurance premiums.
- **Medical Testing**: When you take a medical test, there's a probability of a false positive or false negative. Conditional probability (specifically Bayes' Theorem) is used to calculate the actual probability of having a disease, given a positive test result.
- **Finance and Investing**: Financial analysts model stock price movements using probability distributions to assess the risk and potential return of different investments.
- **Quality Control**: In manufacturing, a manager might use a tree diagram to model the probability of a product being defective, given it came from one of several machines. This helps identify and fix quality issues.
## Podcast Script
[INTRO - 1 minute]
Hello and welcome to A-Level Maths Mastery! I'm your host, and today we're diving deep into one of the most powerful topics in your OCR A-Level Mathematics specification: Probability, specifically section 4.2.
Now, I know probability can feel abstract at first, but here's the thing: this topic is absolutely crucial for your exam success. OCR examiners love probability questions because they test your ability to think logically, use precise mathematical notation, and apply formulas in complex, real-world scenarios. In the next ten minutes, we'll cover the core concepts you absolutely must know, the common pitfalls that trip students up, and the exam techniques that will help you earn every single mark available.
So grab your notes, get comfortable, and let's make probability your strongest topic!
[CORE CONCEPTS - 5 minutes]
Let's start with the foundation: set notation and Venn diagrams. When you see a probability question, the first thing you should do is visualize it. OCR examiners expect you to use proper set notation: the union symbol for "or", the intersection symbol for "and", and the prime symbol for "not". These aren't just fancy symbols - they're the language of probability, and using them correctly will earn you marks.
Here's a key concept that students often misunderstand: the difference between mutually exclusive events and independent events. Mutually exclusive means the events cannot happen at the same time - their intersection is zero. Think of it like this: you can't roll a three and a five on the same die at the same time. Independent events, on the other hand, can happen together, but one doesn't affect the probability of the other. For example, flipping a coin and rolling a die are independent - the coin flip doesn't change what happens with the die.
Now, let's talk about the addition rule. The probability of A or B happening is P of A plus P of B minus P of A and B. That subtraction is crucial! If you forget it, you'll double-count the intersection, and your probability will be greater than one - which is impossible. OCR mark schemes specifically award one mark just for stating this formula correctly before you substitute values.
Moving on to conditional probability - this is where many students lose marks. Conditional probability asks: "What's the probability of A, given that B has already occurred?" The key word here is "given that" - it signals that your sample space has changed. You're no longer looking at all possible outcomes; you're only looking at the outcomes where B happened. The formula is P of A given B equals P of A and B divided by P of B. Think of it as zooming in on event B and asking, "What fraction of B also includes A?"
Here's a pro tip: always draw a Venn diagram for conditional probability questions. It makes the restricted sample space visual and obvious. Examiners give credit for clear diagrams where all probabilities sum to exactly one.
Now, independence. This is a big one. Two events are independent if the occurrence of one doesn't affect the probability of the other. Mathematically, A and B are independent if P of A times P of B equals P of A and B. In "show that" questions, you must explicitly calculate both sides and write a concluding statement like "Since 0.12 equals 0.12, the events are independent." Don't just assume independence - prove it!
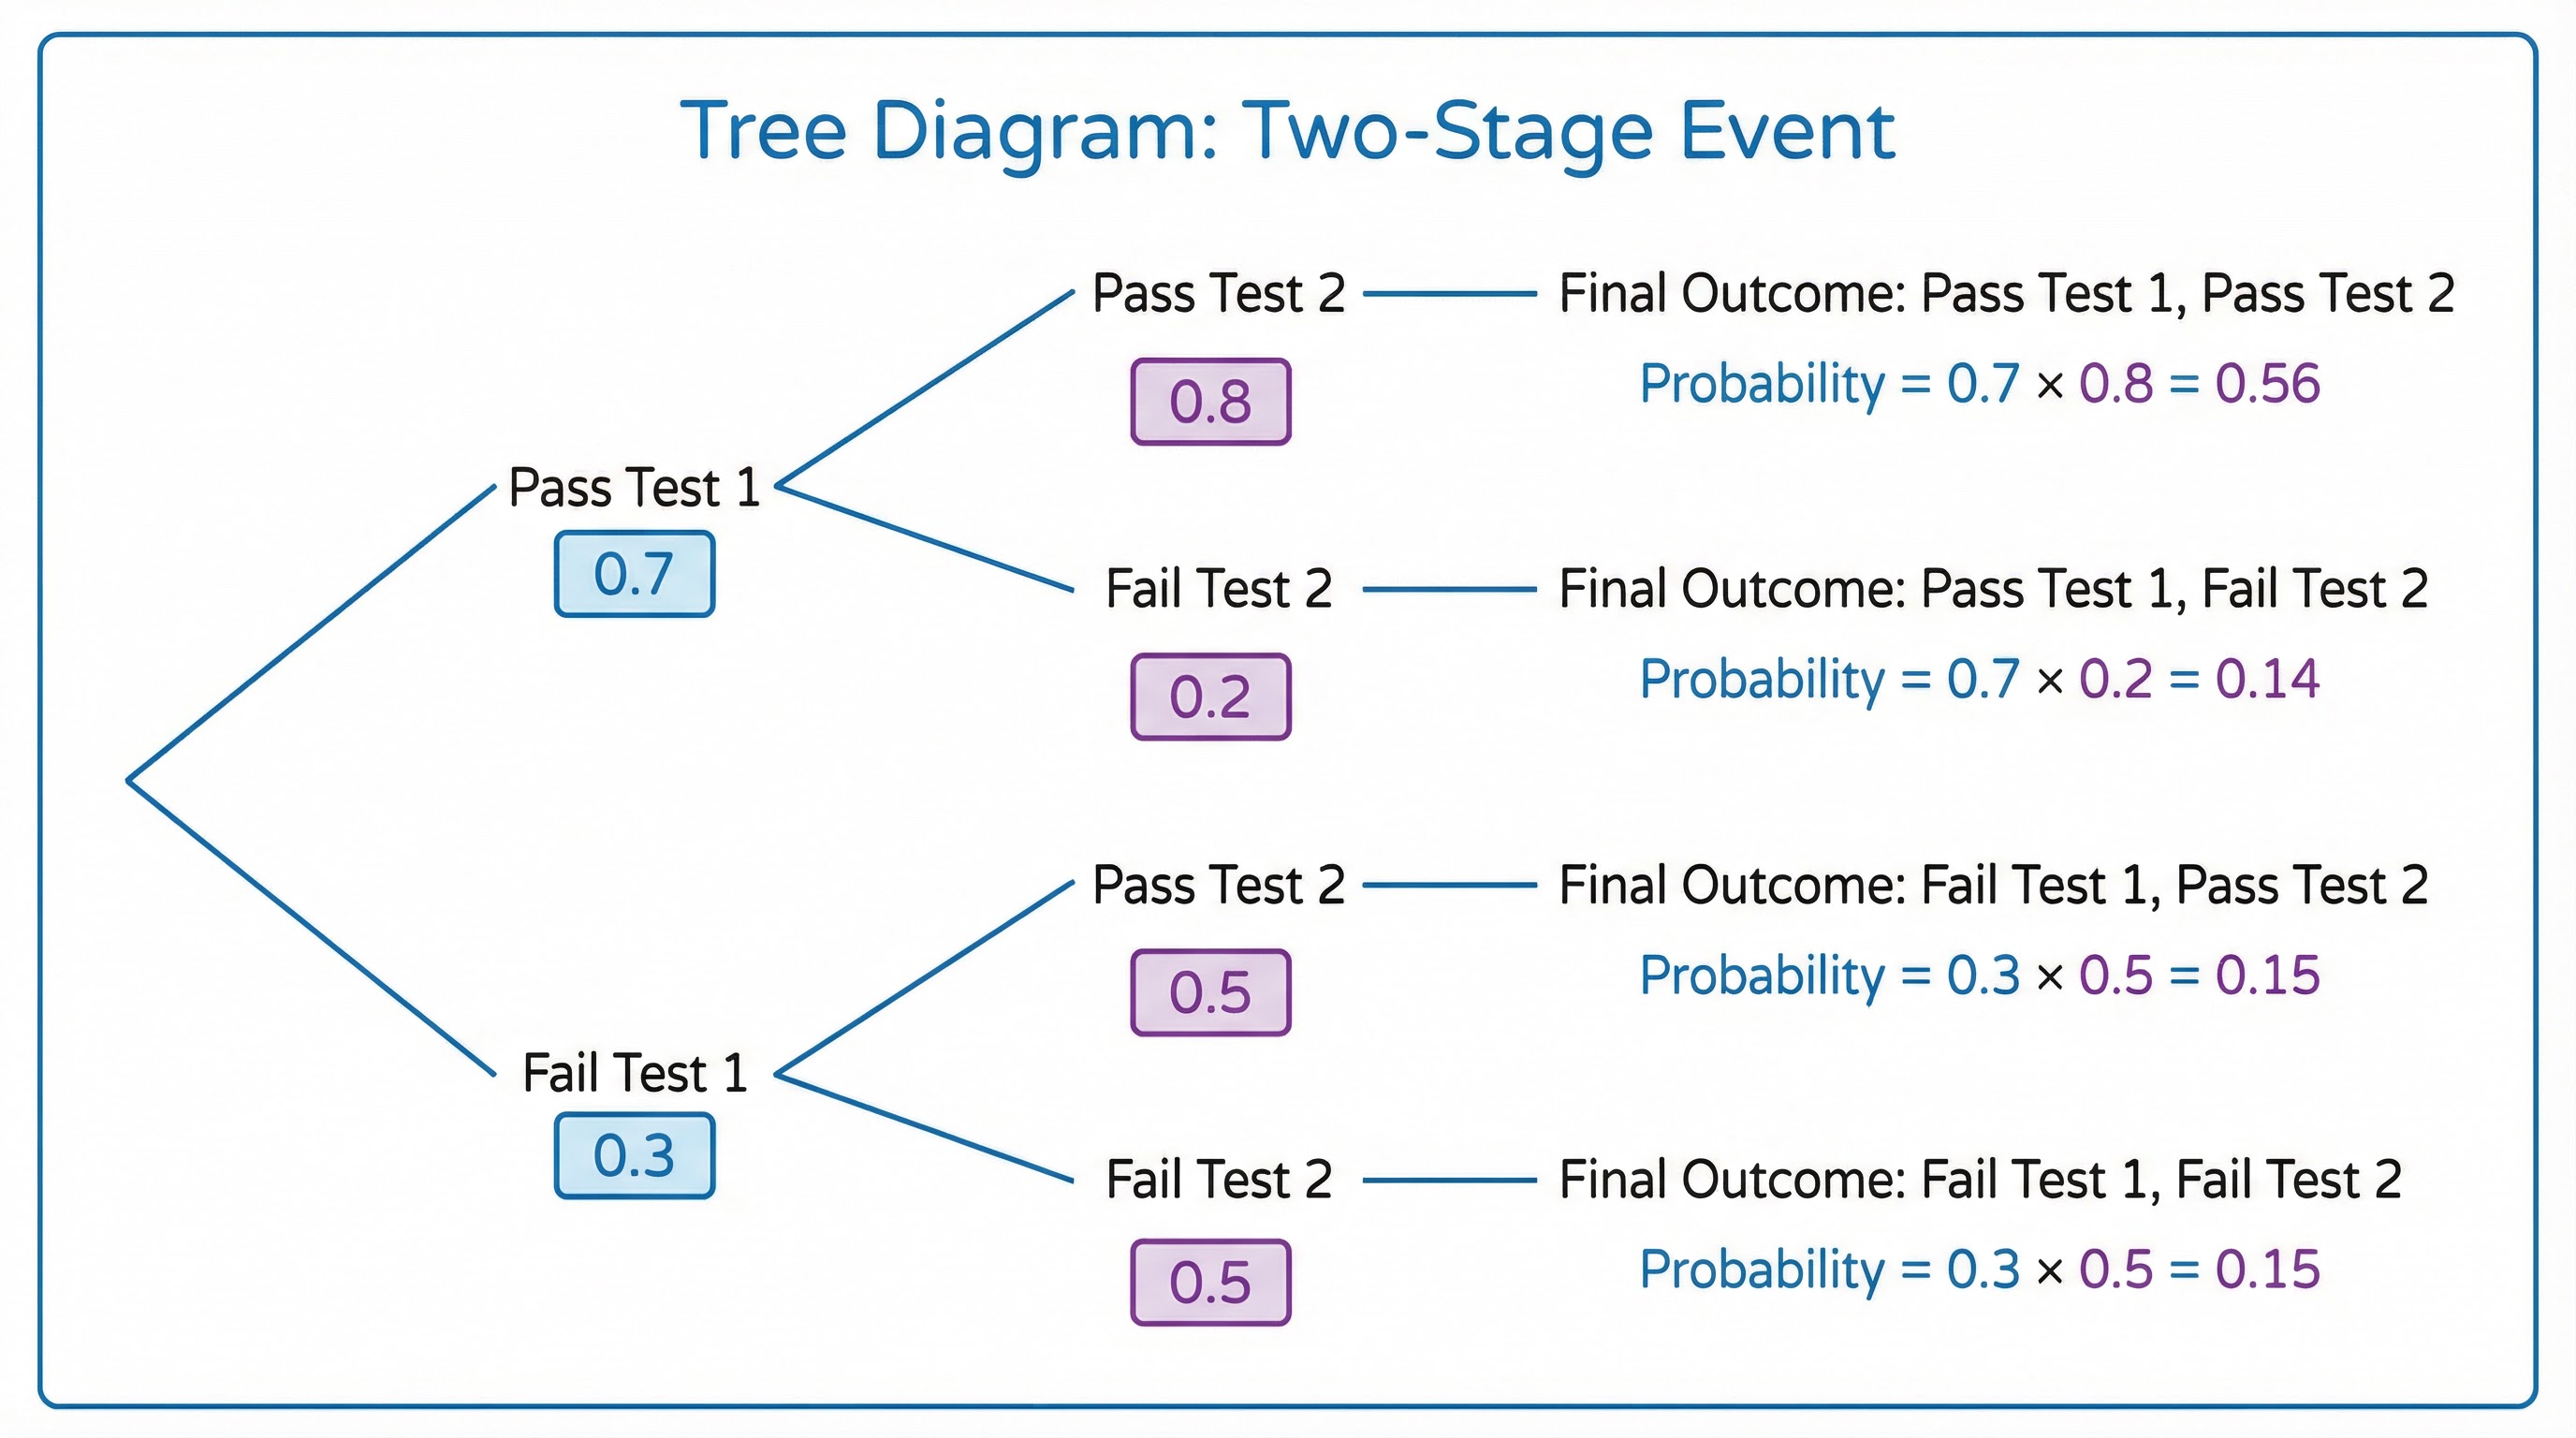
Tree diagrams are your best friend for multi-stage events. Each branch shows a probability, and you multiply along the branches to get the probability of a combined outcome. Remember: probabilities on branches leaving the same point must sum to one. This is a quick check to make sure you haven't made an error.
Finally, two-way tables are brilliant for organizing information, especially in wordy questions. Rows and columns represent different categories, and you fill in the frequencies or probabilities. Once your table is complete, you can read off intersections and unions directly.
[EXAM TIPS & COMMON MISTAKES - 2 minutes]
Let's talk exam strategy. OCR probability questions are typically worth four to six marks, so you should spend about five to seven minutes on each one. Don't rush - these questions reward careful, methodical working.
Here are the top mistakes students make, and how to avoid them. First: confusing mutually exclusive with independent. If you're told events are mutually exclusive, their intersection is zero. If they're independent, you multiply probabilities. These are completely different concepts - don't mix them up!
Second: using the wrong denominator in conditional probability. Remember, when you see "given that B," your denominator is P of B, not the total sample space. Draw that Venn diagram to visualize the restricted space.
Third: forgetting to subtract the intersection when calculating a union. The formula is P of A plus P of B minus P of A and B. That minus sign is essential.
Fourth: not showing enough working in "show that" questions. OCR examiners want to see every step. State the formula, substitute the values, calculate both sides, and write a conclusion. Missing any of these steps will cost you marks.
And finally: poor notation. Use the correct symbols for union, intersection, and complement. Ambiguous notation loses marks, especially in proof questions.
[QUICK-FIRE RECALL QUIZ - 1 minute]
Alright, let's test your recall! I'll ask a question, and you answer out loud. Ready?
Question one: What's the formula for P of A or B?
Answer: P of A plus P of B minus P of A and B.
Question two: How do you test if two events are independent?
Answer: Check if P of A times P of B equals P of A and B.
Question three: What does "given that" signal in a probability question?
Answer: Conditional probability - the sample space has changed.
Question four: If events are mutually exclusive, what is P of A and B?
Answer: Zero.
Question five: In a tree diagram, what do you do to find the probability of a combined outcome?
Answer: Multiply along the branches.
How did you do? If you got all five, you're in great shape! If not, go back and review those concepts.
[SUMMARY & SIGN-OFF - 1 minute]
To wrap up: Probability is all about precision. Use the correct notation, draw diagrams to visualize the problem, and always show your working. Remember the key formulas: the addition rule, the conditional probability formula, and the test for independence. Watch out for those common mistakes - confusing mutually exclusive with independent, using the wrong denominator, and forgetting to subtract the intersection.
Practice is essential. Work through past OCR papers, focusing on probability questions. Pay attention to the mark schemes - they'll show you exactly what examiners are looking for.
You've got this! Probability might seem tricky at first, but with the right approach, it's a reliable source of marks. Keep practicing, stay precise, and you'll ace those exam questions.
Thanks for listening to A-Level Maths Mastery. Good luck with your revision, and I'll see you next time!
"