OCR · GCSE · Biology
Course version: J247 · Version from Sept 2018
Translate information between numerical and graphical forms
Full specification wording
Coordination and control – the endocrine system: translate information between numerical and graphical forms
Translating endocrine datasets between numerical tables and graphical plots is an essential scientific skill.
- Point 2 of 11
- 3 key terms
Study notes
From the teaching notes for this specification point.
The idea
Translating endocrine datasets between numerical tables and graphical plots is an essential scientific skill. Learners must convert raw numerical data representing hormone concentrations, blood glucose measurements, or plant coleoptile curvature angles into accurate graphical formats. Constructing these graphs requires selecting linear, evenly spaced numerical scales that span at least half the available grid, accurately plotting data points using neat crosses, and drawing appropriate smooth curves or straight lines of best fit.
What earns the marks
- Choose sensible, linear numerical scales that allow plotted points to occupy at least half of the graph paper.
- Plot data points accurately to within half a small grid square using small crosses.
- Draw a single, smooth line of best fit or straight line through plotted coordinates without sketching.
- Read numerical coordinates from a graph accurately to complete summary data tables.
Common mistakes and how to put them right
Using uneven or non-linear numerical increments along graph axes.
Connecting plotted points with thick, sketchy lines or forcing a line of best fit through the origin when unsupported by data.
Transposing independent and dependent variables on the graph axes.
Exam tips
- Always place the independent variable on the horizontal axis and the dependent variable on the vertical axis.
- Ensure your scale uses multiples of one, two, or five to make plotting and reading values straightforward.
Try the lesson
The start of the Coordination and control – the endocrine system: translate information between numerical and graphical forms lesson, made from teaching notes for this specification point.
Have a go first
A graph shows a person's blood glucose concentration after a meal. The plotted concentration is 5.0 mmol/dm³ at 0 hours and 8.0 mmol/dm³ at 1 hour. What was the increase in blood glucose concentration between 0 hours and 1 hour?
Listen
Translating endocrine datasets between numerical tables and graphical plots is an essential scientific skill. Learners must convert raw numerical data representing hormone concentrations, blood glucose measurements, or plant coleoptile curvature angles into accurate graphical formats. Constructing these graphs requires selecting linear, evenly spaced numerical scales that span at least half the available grid, accurately plotting data points using neat crosses, and drawing appropriate smooth curves or straight lines of best fit. A strong answer earns marks for these points. choose sensible, linear numerical scales that allow plotted points to occupy at least half of the graph paper. plot data points accurately to within half a small grid square using small crosses. draw a single, smooth line of best fit or straight line through plotted coordinates without sketching. read numerical coordinates from a graph accurately to complete summary data tables. Exam tip: Always place the independent variable on the horizontal axis and the dependent variable on the vertical axis.
See it
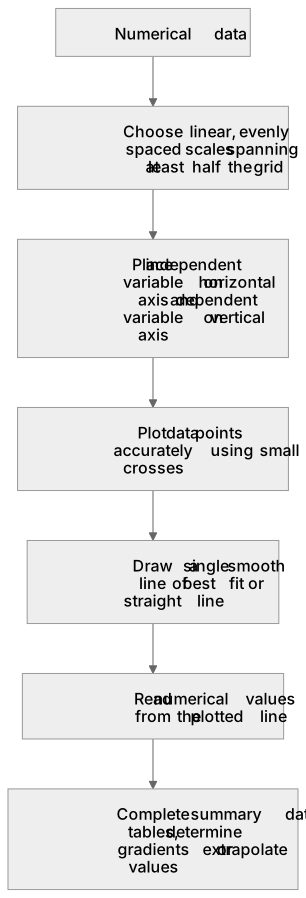
Put it in order
Put these steps in the order they happen.
- 1. Complete summary data tables, determine gradients or extrapolate values
- 2. Read numerical values from the plotted line
- 3. Place independent variable on horizontal axis and dependent variable on vertical axis
- 4. Draw a single smooth line of best fit or straight line
- 5. Numerical data
- 6. Choose linear, evenly spaced scales spanning at least half the grid
- 7. Plot data points accurately using small crosses
Key words
Say what each word means before you turn the card.
scale selection
Try answering aloud or in your head before turning the card.
line of best fit
Try answering aloud or in your head before turning the card.
data translation
Try answering aloud or in your head before turning the card.
See every definition
- scale selection
- Choosing sensible, linear numerical scales that allow plotted points to occupy at least half of the graph paper.
- line of best fit
- A single, smooth line drawn through plotted coordinates without sketching.
- data translation
- Translating information between numerical and graphical forms, including reading numerical coordinates from a graph to complete summary data tables.
Label the diagram
Some boxes have lost their names. Pick the right name for each number.
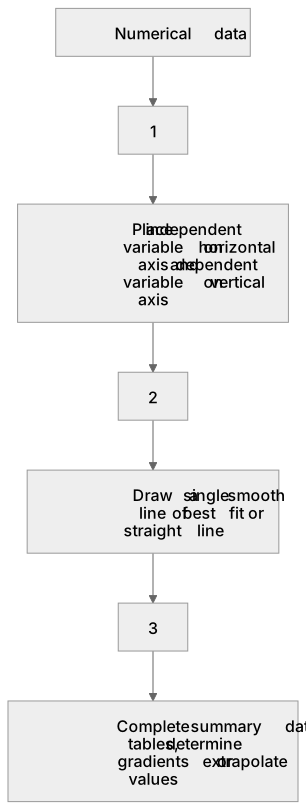
1Box 1
2Box 2
3Box 3
There is more to this lesson
The full lesson goes on to check your understanding and help you earn the marks. Create a free account to carry on, with your progress saved.
A week of Premium from your first lesson · Then the free plan continues · No card, no charge
Test your understanding of Coordination and control – the endocrine system: translate information between numerical and graphical forms
Active recall beats re-reading. Take an instant quiz now to test what you’ve learned and lock it into long-term memory.
A week of Premium from your first lesson · Then the free plan continues · No card, no charge